September 2, 2025
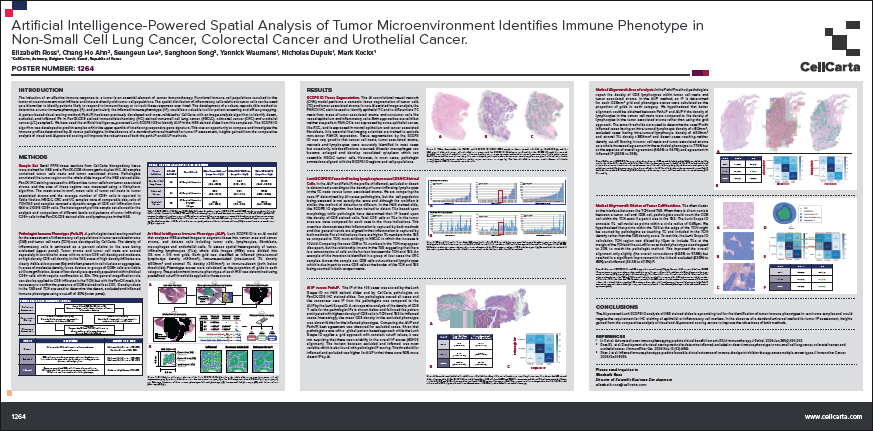
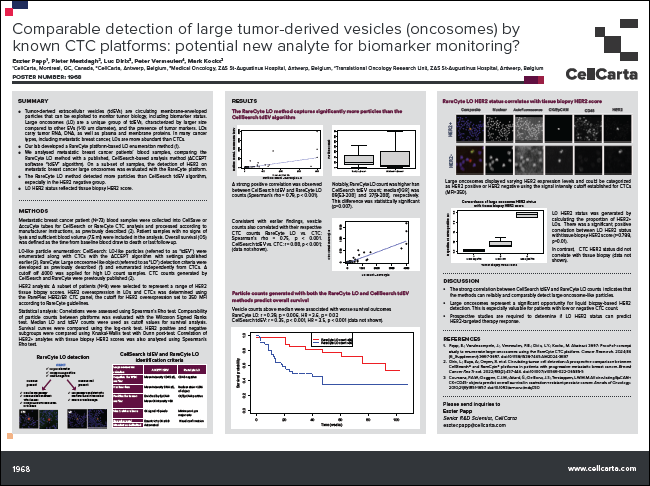
One way to identify the patients likely to respond to immunotherapy is by identifying the distribution of inflammatory cells relative to tumor cells. However, in spite of the compelling association of immune phenotypes with clinical outcome, there are not yet standard definitions or scoring methods.
See how our scientists developed a method for pathologists to identify desert, excluded and inflamed immune phenotypes in our new video!
Want more details? Read the poster!
September 2, 2025
One way to identify the patients likely to respond to immunotherapy is by identifying the distribution of inflammatory cells relative to tumor cells. However, in spite of the compelling association of immune phenotypes with clinical outcome, there are not yet standard definitions or scoring methods.
See how our scientists developed a method for pathologists to identify desert, excluded and inflamed immune phenotypes in our new video!
Want more details? Read the poster!
August 18, 2025
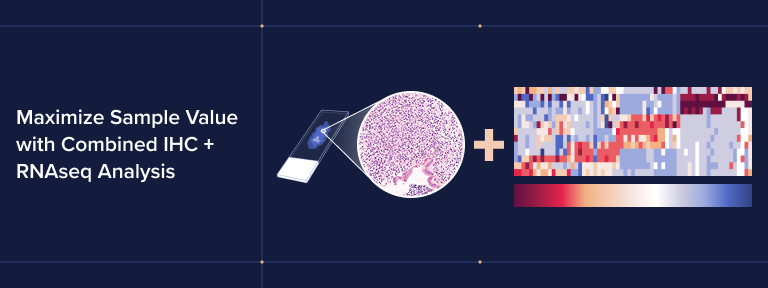
In clinical trials, patient tissue samples are limited, so extracting the most valuable data you can from each slide is critical.
Combining immunohistochemistry (IHC) and RNA sequencing (RNAseq) on the same sample offers a way to increase the insight gained from limited material. However, while many teams are aware of the potential to extract both spatial and molecular data from a single slide, they often exclude RNAseq due to tissue and budget constraints, viewing it as purely exploratory rather than essential for clinical decision-making.
But, with the right approach, RNAseq can be added alongside IHC to unlock molecular insights that extend the value of each tissue sample, generating richer, more connected data.
While IHC provides spatial detail and protein-level expression, RNAseq adds molecular depth, capturing bulk gene expression across a sample to reveal underlying transcriptional activity and mutational burden, supporting a wide range of research applications.
When combined with IHC data from the same sample, RNAseq can offer deeper insight than IHC alone, allowing for:
IHC and RNAseq can also be scaled across large sample volumes, making the combined approach suitable for large-scale clinical studies.
Get in touch to find out how we can support combined IHC and RNAseq analysis.
In immuno-oncology, predicting patient response to immune checkpoint inhibitors (ICI) presents a major challenge. While several features have been shown to correlate with ICI response—e.g., tumor mutational burden (TMB), microsatellite instability (MSI), immune gene expression signatures, and tumor-infiltrating lymphocytes (TILs)—measuring them typically requires multiple different omics techniques.
However, combining multiple techniques is costly and time-consuming, and—most importantly—consumes precious patient material that is often limited and irreplaceable. RNAseq, on the other hand, can overcome these challenges by serving as an all-in-one omics solution, providing comprehensive molecular information from a single experiment.
Through a specially developed suite of data processing and analysis pipelines, CellCarta has established a method of extracting all four key features from RNAseq of tumor samples (Figure 1).
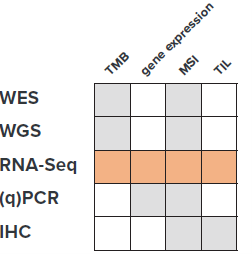
Figure 1: Summary of established features associated with ICI responses and the different techniques used to measure them. WES: whole-exome sequencing, WGS: whole-genome sequencing, RNA-Seq: RNA sequencing, qPCR: quantitative PCR, IHC: immunohistochemistry.
Not only does this method reduce the cost and time associated with analysis, but it also offers the possibility to improve ICI response prediction by integrating features into a single model (Figure 2). For more information on how our RNAseq technique improves response predictions, check out our white paper.
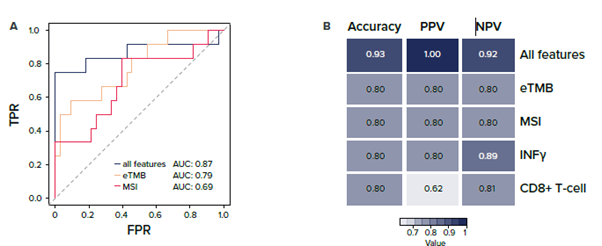
Figure 2: Improved response prediction when integrating all features compared to individual features. A) Logistic regression model incorporating all features (eTMB, MSI, CD8+ T-cell, M1 macrophage, IFNγ signature, and CTL signature; AUC = 0.87) vs. eTMB (AUC = 0.79) and MSI (AUC = 0.69). Higher AUC value for all features compared to eTMB or MSI scoring alone. Prediction performance is demonstrated by a ROC curve and area under the ROC curve (AUC). B) Performance metrics for each model. AUC: area under the ROC curve, TPR: true positive rate, FPR: false positive rate, PPV: positive predictive value, NPV: negative predictive value.
By enabling comprehensive profiling of the tumor and tumor microenvironment from a single sample, CellCarta’s RNAseq workflow makes it easier to generate clinically relevant insights without adding complexity or consuming more tissue. Combined with IHC to add vital spatial and protein-level context, this approach delivers a deeper, more connected picture of tumor biology from limited material, supporting more informed predictive biomarker development and patient selection decisions.
CellCarta supports clinical and translational research teams in implementing IHC and RNAseq workflows that are both efficient and reproducible. Our infrastructure and expertise help ensure high-quality results from limited tissue across sites and studies. We offer:
Whether you’re integrating IHC and RNAseq for the first time or scaling up for a multi-site study, CellCarta is equipped to help you get more from every sample.
Want to explore IHC and RNAseq integration in your next project? Contact our experts.
August 18, 2025
In clinical trials, patient tissue samples are limited, so extracting the most valuable data you can from each slide is critical.
Combining immunohistochemistry (IHC) and RNA sequencing (RNAseq) on the same sample offers a way to increase the insight gained from limited material. However, while many teams are aware of the potential to extract both spatial and molecular data from a single slide, they often exclude RNAseq due to tissue and budget constraints, viewing it as purely exploratory rather than essential for clinical decision-making.
But, with the right approach, RNAseq can be added alongside IHC to unlock molecular insights that extend the value of each tissue sample, generating richer, more connected data.
While IHC provides spatial detail and protein-level expression, RNAseq adds molecular depth, capturing bulk gene expression across a sample to reveal underlying transcriptional activity and mutational burden, supporting a wide range of research applications.
When combined with IHC data from the same sample, RNAseq can offer deeper insight than IHC alone, allowing for:
IHC and RNAseq can also be scaled across large sample volumes, making the combined approach suitable for large-scale clinical studies.
Get in touch to find out how we can support combined IHC and RNAseq analysis.
In immuno-oncology, predicting patient response to immune checkpoint inhibitors (ICI) presents a major challenge. While several features have been shown to correlate with ICI response—e.g., tumor mutational burden (TMB), microsatellite instability (MSI), immune gene expression signatures, and tumor-infiltrating lymphocytes (TILs)—measuring them typically requires multiple different omics techniques.
However, combining multiple techniques is costly and time-consuming, and—most importantly—consumes precious patient material that is often limited and irreplaceable. RNAseq, on the other hand, can overcome these challenges by serving as an all-in-one omics solution, providing comprehensive molecular information from a single experiment.
Through a specially developed suite of data processing and analysis pipelines, CellCarta has established a method of extracting all four key features from RNAseq of tumor samples (Figure 1).
Figure 1: Summary of established features associated with ICI responses and the different techniques used to measure them. WES: whole-exome sequencing, WGS: whole-genome sequencing, RNA-Seq: RNA sequencing, qPCR: quantitative PCR, IHC: immunohistochemistry.
Not only does this method reduce the cost and time associated with analysis, but it also offers the possibility to improve ICI response prediction by integrating features into a single model (Figure 2). For more information on how our RNAseq technique improves response predictions, check out our white paper.
Figure 2: Improved response prediction when integrating all features compared to individual features. A) Logistic regression model incorporating all features (eTMB, MSI, CD8+ T-cell, M1 macrophage, IFNγ signature, and CTL signature; AUC = 0.87) vs. eTMB (AUC = 0.79) and MSI (AUC = 0.69). Higher AUC value for all features compared to eTMB or MSI scoring alone. Prediction performance is demonstrated by a ROC curve and area under the ROC curve (AUC). B) Performance metrics for each model. AUC: area under the ROC curve, TPR: true positive rate, FPR: false positive rate, PPV: positive predictive value, NPV: negative predictive value.
By enabling comprehensive profiling of the tumor and tumor microenvironment from a single sample, CellCarta’s RNAseq workflow makes it easier to generate clinically relevant insights without adding complexity or consuming more tissue. Combined with IHC to add vital spatial and protein-level context, this approach delivers a deeper, more connected picture of tumor biology from limited material, supporting more informed predictive biomarker development and patient selection decisions.
CellCarta supports clinical and translational research teams in implementing IHC and RNAseq workflows that are both efficient and reproducible. Our infrastructure and expertise help ensure high-quality results from limited tissue across sites and studies. We offer:
Whether you’re integrating IHC and RNAseq for the first time or scaling up for a multi-site study, CellCarta is equipped to help you get more from every sample.
Want to explore IHC and RNAseq integration in your next project? Contact our experts.
April 16, 2025
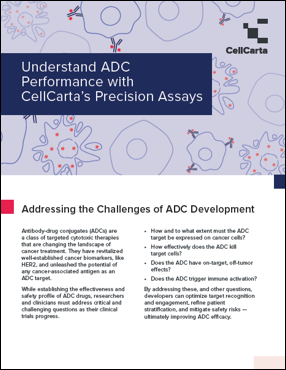
Our team developed a comprehensive suite of precision assays to support every stage of antibody-drug conjugate (ADC) development.
From confirming target expression and measuring density, to evaluating drug-target engagement, pharmacokinetics, and safety, CellCarta employs a data-driven, multiplatform approach.
Our solutions include multiplex IF and IHC, flow cytometry, mass spectrometry, RNA sequencing, and spatial biology technologies, ensuring precise target quantification and in-depth tumor microenvironment analysis.
With global facilities, companion diagnostic (CDx) expertise, and full logistics support, CellCarta helps biopharma partners accelerate their ADC programs.
Advance your ADC programs with CellCarta! Contact us today to discover how our precision assays and scientific expertise can drive your clinical success.
April 16, 2025
Our team developed a comprehensive suite of precision assays to support every stage of antibody-drug conjugate (ADC) development.
From confirming target expression and measuring density, to evaluating drug-target engagement, pharmacokinetics, and safety, CellCarta employs a data-driven, multiplatform approach.
Our solutions include multiplex IF and IHC, flow cytometry, mass spectrometry, RNA sequencing, and spatial biology technologies, ensuring precise target quantification and in-depth tumor microenvironment analysis.
With global facilities, companion diagnostic (CDx) expertise, and full logistics support, CellCarta helps biopharma partners accelerate their ADC programs.
Advance your ADC programs with CellCarta! Contact us today to discover how our precision assays and scientific expertise can drive your clinical success.