Emerging ADC Biomarkers

April 14, 2026
Antibody-drug conjugates (ADCs) have emerged as one of the most promising therapeutic modalities in oncology. To date, 21 ADCs have been approved worldwide1, with hundreds more currently in clinical development.2 While a small group of established biomarkers—HER2, TROP2, EGFR, and Claudin18.2—currently dominate the field and account for more than half of ADC clinical pipelines3, the landscape is quickly evolving.

A growing number of new biomarker targets are now entering ADC development programs, reflecting both advances in tumor biology and increasing investment across the pharmaceutical industry. As these targets emerge, laboratories must stay ahead of the field to support their measurement and validation.

Key biomarkers gaining traction in ADC development

Beyond the dominating, established biomarkers, recent advances in tumor biology have identified a number of additional antigens with characteristics that make them promising ADC targets.

HER3, for example, which is commonly overexpressed in non-small cell lung cancer (NSCLC) and breast cancer, has become the focus of several ADC programs, with the investigational therapy patritumab-deruxtecan showing promising efficacy in NSCLC and breast cancer.4

Similarly, B7-H4, an immune checkpoint protein, is overexpressed in several epithelial cancers while showing relatively limited expression in normal tissues, making it an attractive target for therapeutic development.5 In a phase-I dose-escalation trial, a B7-H4-directed dolasynthen ADC demonstrated promising antitumor activity and a manageable safety profile, highlighting the potential of this antigen as a therapeutic target.5

Other emerging targets are also gaining traction in ADC research. For example, ROR1 and CEACAM5 have been investigated as tumor-associated antigens in multiple solid tumors6,7, while CD142 (tissue factor) has been explored as a target for ADCs due to its role in tumor progression and angiogenesis.8

As researchers continue to identify tumor-associated proteins with favorable expression profiles and biological relevance, the number of potential ADC biomarkers will continue to grow.

Characterizing emerging ADC biomarkers

As new ADC targets continue to be identified, accurately characterizing their expression within tumor tissues will be critical for the development of next-generation ADC therapies. For ADCs, both the level and spatial distribution of target antigen expression can directly influence drug binding, internalization, and ultimately therapeutic efficacy.

Many tumor-associated antigens display heterogeneous expression across tumor types, between patients, and even within different regions of the same tumor, making biomarker evaluation more complex.9 In addition, newly identified targets may lack well-established antibodies or validated assays, creating further challenges when attempting to assess target prevalence and suitability during early development.

Enabling biomarker evaluation for next-generation ADC targets

To support the growing number of biomarker targets entering ADC development pipelines, we are expanding our portfolio of tissue-based biomarker assays at our California, Lake Forest laboratory. The site currently offers immunohistochemistry (IHC) assays for several established ADC targets and is actively developing assays for a range of emerging biomarkers identified through ongoing research across the ADC field (Table 1).

Current ADC biomarker assays Biomarkers coming in 2026
B7H3 CDCP1
Claudin18.2 B7-H4
cMET STEAP1
DLL3 CD25
EGFR HER3
FOLR1 CEACAM5
HER2 CD142
Nectin2 ROR1
TROP2 SEZ6

Table 1: Table to show current and emerging biomarker offering at the CellCarta Lake Forest Laboratory

At the Lake Forest facility, these targets are evaluated using singleplex and multiplex immunohistochemistry (IHC) and multiplex immunofluorescence, and spatial biology approaches, including COMET™, further enable high-plex analysis of biomarker expression within the tumour microenvironment. The site supports the rapid development of assays for emerging ADC biomarkers, enabling researchers to characterize antigen expression within tumor tissue and generate data that support biomarker discovery, target validation, and clinical development.

As ADC development continues to evolve, the range of tumor-associated antigens under investigation is expanding well beyond a small group of established targets. New biomarkers are emerging across multiple tumor types, reflecting both advances in tumor biology and growing interest from pharmaceutical developers.

As this landscape continues to broaden, the ability to rapidly evaluate and characterize emerging targets will be essential for translating new discoveries into viable ADC therapies.

 Working on an ADC development program?

Connect with CellCarta’s Lake Forest team to discuss how we can support biomarker evaluation for ADC targets.

About CellCarta’s California, Lake Forest Laboratory

For over 20 years, CellCarta’s CLIA and CAP-accredited Lake Forest laboratory has supported pharmaceutical and biotechnology sponsors across preclinical, discovery, and clinical development programs. Key capabilities include:

  • Multiplex immunohistochemistry and immunofluorescence expertise
  • Integrated digital pathology and spatial analysis workflows
  • In-house tissue biobank access
  • Rapid turnaround times designed for early-stage decision-making

Since its opening, the Lake Forest team has worked with over 230 sponsors on over 2,400 unique projects. Operating independently and capable of participating in multi-site joint studies, Lake Forest delivers the speed and flexibility required to advance early-stage programs with confidence.

Find out more about our Lake Forest lab and how it can support your early-stage programs

About the Author:

author photo

Steven Wilkes is a Scientific Business Director at CellCarta, specializing in the histopathology platform.  Steven has 15+ years of experience in the field of histopathology at academic centers, large pharmaceutical companies, and clinical laboratories.  At CellCarta, Steven uses his expertise to help our clients find the best scientific and technical solutions to address their program needs.

References

  1. https://www.biochempeg.com/article/208.html
  2. https://www.biochempeg.com/article/447.html
  3. https://www.linkedin.com/pulse/global-adc-drug-clinical-development-2025-key-d3t5c/
  4. https://www.mdpi.com/1422-0067/26/13/6523
  5. https://www.targetedonc.com/view/early-phase-study-shows-promise-for-novel-b7-h4-targeted-adc
  6. https://academic.oup.com/abt/article/4/4/222/6397795
  7. https://www.sciencedirect.com/science/article/pii/S0923753422000035
  8. https://link.springer.com/article/10.1186/s40364-023-00504-6
  9. https://www.mdpi.com/1424-8247/18/6/915
Emerging ADC Biomarkers

April 14, 2026

Antibody-drug conjugates (ADCs) have emerged as one of the most promising therapeutic modalities in oncology. To date, 21 ADCs have been approved worldwide1, with hundreds more currently in clinical development.2 While a small group of established biomarkers—HER2, TROP2, EGFR, and Claudin18.2—currently dominate the field and account for more than half of ADC clinical pipelines3, the landscape is quickly evolving.

A growing number of new biomarker targets are now entering ADC development programs, reflecting both advances in tumor biology and increasing investment across the pharmaceutical industry. As these targets emerge, laboratories must stay ahead of the field to support their measurement and validation.

Key biomarkers gaining traction in ADC development

Beyond the dominating, established biomarkers, recent advances in tumor biology have identified a number of additional antigens with characteristics that make them promising ADC targets.

HER3, for example, which is commonly overexpressed in non-small cell lung cancer (NSCLC) and breast cancer, has become the focus of several ADC programs, with the investigational therapy patritumab-deruxtecan showing promising efficacy in NSCLC and breast cancer.4

Similarly, B7-H4, an immune checkpoint protein, is overexpressed in several epithelial cancers while showing relatively limited expression in normal tissues, making it an attractive target for therapeutic development.5 In a phase-I dose-escalation trial, a B7-H4-directed dolasynthen ADC demonstrated promising antitumor activity and a manageable safety profile, highlighting the potential of this antigen as a therapeutic target.5

Other emerging targets are also gaining traction in ADC research. For example, ROR1 and CEACAM5 have been investigated as tumor-associated antigens in multiple solid tumors6,7, while CD142 (tissue factor) has been explored as a target for ADCs due to its role in tumor progression and angiogenesis.8

As researchers continue to identify tumor-associated proteins with favorable expression profiles and biological relevance, the number of potential ADC biomarkers will continue to grow.

Characterizing emerging ADC biomarkers

As new ADC targets continue to be identified, accurately characterizing their expression within tumor tissues will be critical for the development of next-generation ADC therapies. For ADCs, both the level and spatial distribution of target antigen expression can directly influence drug binding, internalization, and ultimately therapeutic efficacy.

Many tumor-associated antigens display heterogeneous expression across tumor types, between patients, and even within different regions of the same tumor, making biomarker evaluation more complex.9 In addition, newly identified targets may lack well-established antibodies or validated assays, creating further challenges when attempting to assess target prevalence and suitability during early development.

Enabling biomarker evaluation for next-generation ADC targets

To support the growing number of biomarker targets entering ADC development pipelines, we are expanding our portfolio of tissue-based biomarker assays at our California, Lake Forest laboratory. The site currently offers immunohistochemistry (IHC) assays for several established ADC targets and is actively developing assays for a range of emerging biomarkers identified through ongoing research across the ADC field (Table 1).

Current ADC biomarker assays Biomarkers coming in 2026
B7H3 CDCP1
Claudin18.2 B7-H4
cMET STEAP1
DLL3 CD25
EGFR HER3
FOLR1 CEACAM5
HER2 CD142
Nectin2 ROR1
TROP2 SEZ6

Table 1: Table to show current and emerging biomarker offering at the CellCarta Lake Forest Laboratory

At the Lake Forest facility, these targets are evaluated using singleplex and multiplex immunohistochemistry (IHC) and multiplex immunofluorescence, and spatial biology approaches, including COMET™, further enable high-plex analysis of biomarker expression within the tumour microenvironment. The site supports the rapid development of assays for emerging ADC biomarkers, enabling researchers to characterize antigen expression within tumor tissue and generate data that support biomarker discovery, target validation, and clinical development.

As ADC development continues to evolve, the range of tumor-associated antigens under investigation is expanding well beyond a small group of established targets. New biomarkers are emerging across multiple tumor types, reflecting both advances in tumor biology and growing interest from pharmaceutical developers.

As this landscape continues to broaden, the ability to rapidly evaluate and characterize emerging targets will be essential for translating new discoveries into viable ADC therapies.

 Working on an ADC development program?

Connect with CellCarta’s Lake Forest team to discuss how we can support biomarker evaluation for ADC targets.

About CellCarta’s California, Lake Forest Laboratory

For over 20 years, CellCarta’s CLIA and CAP-accredited Lake Forest laboratory has supported pharmaceutical and biotechnology sponsors across preclinical, discovery, and clinical development programs. Key capabilities include:

  • Multiplex immunohistochemistry and immunofluorescence expertise
  • Integrated digital pathology and spatial analysis workflows
  • In-house tissue biobank access
  • Rapid turnaround times designed for early-stage decision-making

Since its opening, the Lake Forest team has worked with over 230 sponsors on over 2,400 unique projects. Operating independently and capable of participating in multi-site joint studies, Lake Forest delivers the speed and flexibility required to advance early-stage programs with confidence.

Find out more about our Lake Forest lab and how it can support your early-stage programs

About the Author:

author photo

Steven Wilkes is a Scientific Business Director at CellCarta, specializing in the histopathology platform.  Steven has 15+ years of experience in the field of histopathology at academic centers, large pharmaceutical companies, and clinical laboratories.  At CellCarta, Steven uses his expertise to help our clients find the best scientific and technical solutions to address their program needs.

References

  1. https://www.biochempeg.com/article/208.html
  2. https://www.biochempeg.com/article/447.html
  3. https://www.linkedin.com/pulse/global-adc-drug-clinical-development-2025-key-d3t5c/
  4. https://www.mdpi.com/1422-0067/26/13/6523
  5. https://www.targetedonc.com/view/early-phase-study-shows-promise-for-novel-b7-h4-targeted-adc
  6. https://academic.oup.com/abt/article/4/4/222/6397795
  7. https://www.sciencedirect.com/science/article/pii/S0923753422000035
  8. https://link.springer.com/article/10.1186/s40364-023-00504-6
  9. https://www.mdpi.com/1424-8247/18/6/915
CellCarta Lake Forest | Rapid Clinical Testing

April 14, 2026

We know meeting critical deadlines is key. After developing two new 6-plex mIF assays, we were able to deliver 9,000+ datapoints in <6 weeks, ahead of submission deadlines.

External milestones place significant pressure on early-stage and translational programs.

That was the case during a rheumatoid arthritis study conducted for a biotech company at CellCarta’s Lake Forest, California laboratory. The project required the rapid development of two new multiplex immunofluorescence (mIF) assays and their transition into clinical sample testing within a compressed timeline tied to an upcoming conference submission deadline.

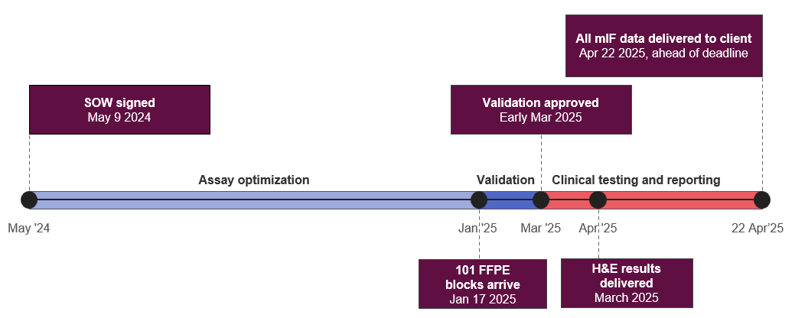
Here, we highlight how the Lake Forest team combined rapid assay validation with coordinated clinical testing to deliver ahead of the sponsor’s deadline (Figure 1).

87 samples – both 6-plex mIF assays completed in 6 weeks and 9,000 data points delivered ahead of schedule.

Figure 1: Key milestones of the project at the Lake Forest laboratory. With coordination across teams, the lab was able to move from contract signing to conference-ready data in under 12 months, delivering to the client ahead of schedule.

Optimizing Two New mIF Assays for Rheumatoid Arthritis

The initial phase of the project focused on optimizing two six-plex multiplex immunofluorescence assays on the Akoya platform for use in rheumatoid arthritis tissue samples, a new indication for the Lake Forest Laboratory.

Optimization was carried out between May and December 2024, followed by validation staining and digital image analysis algorithm development in January and February 2025.

Due to the indication, algorithm development proved to be particularly complex, but through careful prioritization and close collaboration between the sponsor, pathology, image analysis scientists, and assay development scientists, the team managed to make quick progress to meet the required deadline.

During this phase, the team also created custom Hematoxylin and Eosin (H&E) evaluation forms for rheumatoid arthritis. These forms were developed to support both assay validation and future clinical sample review, enabling the same tailored pathology evaluation process to be applied across both stages of the project.

Coordinating Development and Clinical Execution

The 101 clinical FFPE block samples arrived at the Lake Forest laboratory on January 17, 2025, while assay validation was being finalized.

To keep the project aligned with the sponsor’s timeline for data delivery by the end of April, the team created a detailed plan for each department to execute as soon as the sponsor approved the full validation package. This close collaboration across assay development, laboratory operations, pathology, digital pathology, and data teams ensured efficient tissue sectioning, staining, and analysis workflows. With this in place, the Lake Forest team was able to:

  • Freshly section all FFPE blocks to retain antigenicity, which is critical in mIF testing.
  • Deliver H&E results in March, allowing the sponsor to quickly review the samples and select those that would proceed to multiplex immunofluorescence analysis.
  • Complete testing and analysis of 87 sponsor-selected samples for both 6-plex mIF assays in just six weeks. All multiplex data, totaling over 9,000 data points (87 samples, each with 105 reported fields), was sent by April 22, ahead of the sponsor’s submission deadline.
  • Deliver the results and associated images in ready-to-use formats ahead of the deadline, enabling the sponsor to review the findings and incorporate the data directly into their conference presentation.

Maintaining Momentum When Timelines Are Fixed

Scientific and translational programs often operate against immovable deadlines. When that happens, sponsors need partners who can move quickly without compromising scientific rigor.

At Lake Forest, close coordination between assay development, pathology, and clinical operations allowed complex assay work and large-scale sample testing to proceed in parallel, helping the sponsor deliver critical data in time for their submission milestone.

Looking for a scientific partner for your next study? Connect with our team to find out how we can support your program.

About CellCarta’s California, Lake Forest Laboratory

For over 20 years, CellCarta’s CLIA and CAP-accredited Lake Forest laboratory has supported pharmaceutical and biotechnology sponsors across preclinical, discovery, and clinical development programs. Key capabilities include:

  • Multiplex immunohistochemistry and immunofluorescence expertise
  • Integrated digital pathology and spatial analysis workflows
  • In-house tissue biobank access
  • Rapid turnaround times designed for early-stage decision-making

Since its opening, the Lake Forest team has worked with over 230 sponsors on over 2,400 unique projects. Operating independently and capable of participating in multi-site joint studies, Lake Forest delivers the speed and flexibility required to advance early-stage programs with confidence.

Find out more about our Lake Forest lab and how it can support your early-stage programs.

About the Author:

author photo

Andrea Reigel is the Director of US Project Management at CellCarta, leading teams across Lake Forest, CA and Naperville, IL in the delivery of complex clinical trial projects. With a B.S. in Biology, an MBA, and a PMP certification, she brings a mix of scientific knowledge, project management expertise, and strategic leadership to every engagement. At CellCarta, she guides major client partnerships, builds and develops operational teams, and drives process improvements that elevate customer service and project execution.

CellCarta Lake Forest | Rapid Clinical Testing

April 14, 2026

We know meeting critical deadlines is key. After developing two new 6-plex mIF assays, we were able to deliver 9,000+ datapoints in <6 weeks, ahead of submission deadlines.

External milestones place significant pressure on early-stage and translational programs.

That was the case during a rheumatoid arthritis study conducted for a biotech company at CellCarta’s Lake Forest, California laboratory. The project required the rapid development of two new multiplex immunofluorescence (mIF) assays and their transition into clinical sample testing within a compressed timeline tied to an upcoming conference submission deadline.

Here, we highlight how the Lake Forest team combined rapid assay validation with coordinated clinical testing to deliver ahead of the sponsor’s deadline (Figure 1).

87 samples – both 6-plex mIF assays completed in 6 weeks and 9,000 data points delivered ahead of schedule.

Figure 1: Key milestones of the project at the Lake Forest laboratory. With coordination across teams, the lab was able to move from contract signing to conference-ready data in under 12 months, delivering to the client ahead of schedule.

Optimizing Two New mIF Assays for Rheumatoid Arthritis

The initial phase of the project focused on optimizing two six-plex multiplex immunofluorescence assays on the Akoya platform for use in rheumatoid arthritis tissue samples, a new indication for the Lake Forest Laboratory.

Optimization was carried out between May and December 2024, followed by validation staining and digital image analysis algorithm development in January and February 2025.

Due to the indication, algorithm development proved to be particularly complex, but through careful prioritization and close collaboration between the sponsor, pathology, image analysis scientists, and assay development scientists, the team managed to make quick progress to meet the required deadline.

During this phase, the team also created custom Hematoxylin and Eosin (H&E) evaluation forms for rheumatoid arthritis. These forms were developed to support both assay validation and future clinical sample review, enabling the same tailored pathology evaluation process to be applied across both stages of the project.

Coordinating Development and Clinical Execution

The 101 clinical FFPE block samples arrived at the Lake Forest laboratory on January 17, 2025, while assay validation was being finalized.

To keep the project aligned with the sponsor’s timeline for data delivery by the end of April, the team created a detailed plan for each department to execute as soon as the sponsor approved the full validation package. This close collaboration across assay development, laboratory operations, pathology, digital pathology, and data teams ensured efficient tissue sectioning, staining, and analysis workflows. With this in place, the Lake Forest team was able to:

  • Freshly section all FFPE blocks to retain antigenicity, which is critical in mIF testing.
  • Deliver H&E results in March, allowing the sponsor to quickly review the samples and select those that would proceed to multiplex immunofluorescence analysis.
  • Complete testing and analysis of 87 sponsor-selected samples for both 6-plex mIF assays in just six weeks. All multiplex data, totaling over 9,000 data points (87 samples, each with 105 reported fields), was sent by April 22, ahead of the sponsor’s submission deadline.
  • Deliver the results and associated images in ready-to-use formats ahead of the deadline, enabling the sponsor to review the findings and incorporate the data directly into their conference presentation.

Maintaining Momentum When Timelines Are Fixed

Scientific and translational programs often operate against immovable deadlines. When that happens, sponsors need partners who can move quickly without compromising scientific rigor.

At Lake Forest, close coordination between assay development, pathology, and clinical operations allowed complex assay work and large-scale sample testing to proceed in parallel, helping the sponsor deliver critical data in time for their submission milestone.

Looking for a scientific partner for your next study? Connect with our team to find out how we can support your program.

About CellCarta’s California, Lake Forest Laboratory

For over 20 years, CellCarta’s CLIA and CAP-accredited Lake Forest laboratory has supported pharmaceutical and biotechnology sponsors across preclinical, discovery, and clinical development programs. Key capabilities include:

  • Multiplex immunohistochemistry and immunofluorescence expertise
  • Integrated digital pathology and spatial analysis workflows
  • In-house tissue biobank access
  • Rapid turnaround times designed for early-stage decision-making

Since its opening, the Lake Forest team has worked with over 230 sponsors on over 2,400 unique projects. Operating independently and capable of participating in multi-site joint studies, Lake Forest delivers the speed and flexibility required to advance early-stage programs with confidence.

Find out more about our Lake Forest lab and how it can support your early-stage programs.

About the Author:

author photo

Andrea Reigel is the Director of US Project Management at CellCarta, leading teams across Lake Forest, CA and Naperville, IL in the delivery of complex clinical trial projects. With a B.S. in Biology, an MBA, and a PMP certification, she brings a mix of scientific knowledge, project management expertise, and strategic leadership to every engagement. At CellCarta, she guides major client partnerships, builds and develops operational teams, and drives process improvements that elevate customer service and project execution.

TBNK Panels: How To Select the Optimal One

November 25, 2025

Flow cytometry–based TBNK panels are a mainstay of immune profiling, used to accurately enumerate T cells, B cells, and natural killer (NK) cells for a range of clinical purposes. Using the right TBNK panel configuration is essential for generating relevant results that support confident clinical decision-making, but identifying the most suitable option can be challenging.  

In this blog, we explore the key factors that influence TBNK panel selection and the importance of validated, standardized approaches in generating valuable immune profiling data

Why use a TBNK panel 

Accurate immune profiling is central to understanding the processes that influence how patients will respond to therapeutic interventions, and the reliability of those insights depends on consistent measurement of key lymphocyte populations. TBNK panels provide a standardized framework for generating that data, allowing immune responses to be compared across time points, patients, or clinical sites.  

By staining blood samples with antibodies that recognize cell surface markers, typically including CD3, CD4, CD8, CD19, and CD16/56, TBNK panels provide a high-level quantitative overview of a patient’s immune composition. Because different studies may focus on different immune subsets or endpoints, there are multiple TBNK panel configurations you can choose from. Each panel configuration provides distinct insights, and selecting the appropriate one ensures that the data generated is relevant and interpretable within the clinical context. 

How do you choose the right TBNK panel? 

Several factors influence which TBNK panel configuration is most appropriate for a given study or clinical application. 

Therapeutic target 

When and how a TBNK panel is deployed is largely determined by the type of therapy being investigated. Currently, TBNK analysis is most often used to track B-cell aplasia or T-cell expansion and contraction, applications that are particularly relevant to CAR-T and T-cell engager (TCE) therapies targeting B cells.  

Once the decision is made to use a TBNK assay, panel design is guided by the therapeutic target and the immune cell populations most relevant to the study. Standard off-the-shelf (OTS) configurations are often used as a foundation, but these can be adapted to specific study questions with additional markers.  

Regulatory and clinical context 

If data is to be included in regulatory submissions, an assay with the appropriate validation or IVD certification should be used to ensure compliance and data integrity. Other panel configurations may be validated for use in clinical settings, where they can support applications such as defining secondary endpoints or establishing patient onboarding and exclusion criteria.  

Turnaround time and workflow 

For clinical decision-making, rapid and standardized data delivery is also a key factor. An off-the-shelf, validated TBNK workflow allows for efficient processing and official reporting, enabling timely decisions such as the release of healthy donors based on B-cell repopulation following anti-B-cell therapy. 

Validated TBNK Panels from CellCarta 

Whatever your specific needs, CellCarta offers a portfolio of validated TBNK flow cytometry panels. Each panel has been validated in-house and cross-validated across CellCarta’s global sites to confirm reproducible performance between laboratories, with emphasis given to stability testing to ensure consistent performance over time. .  

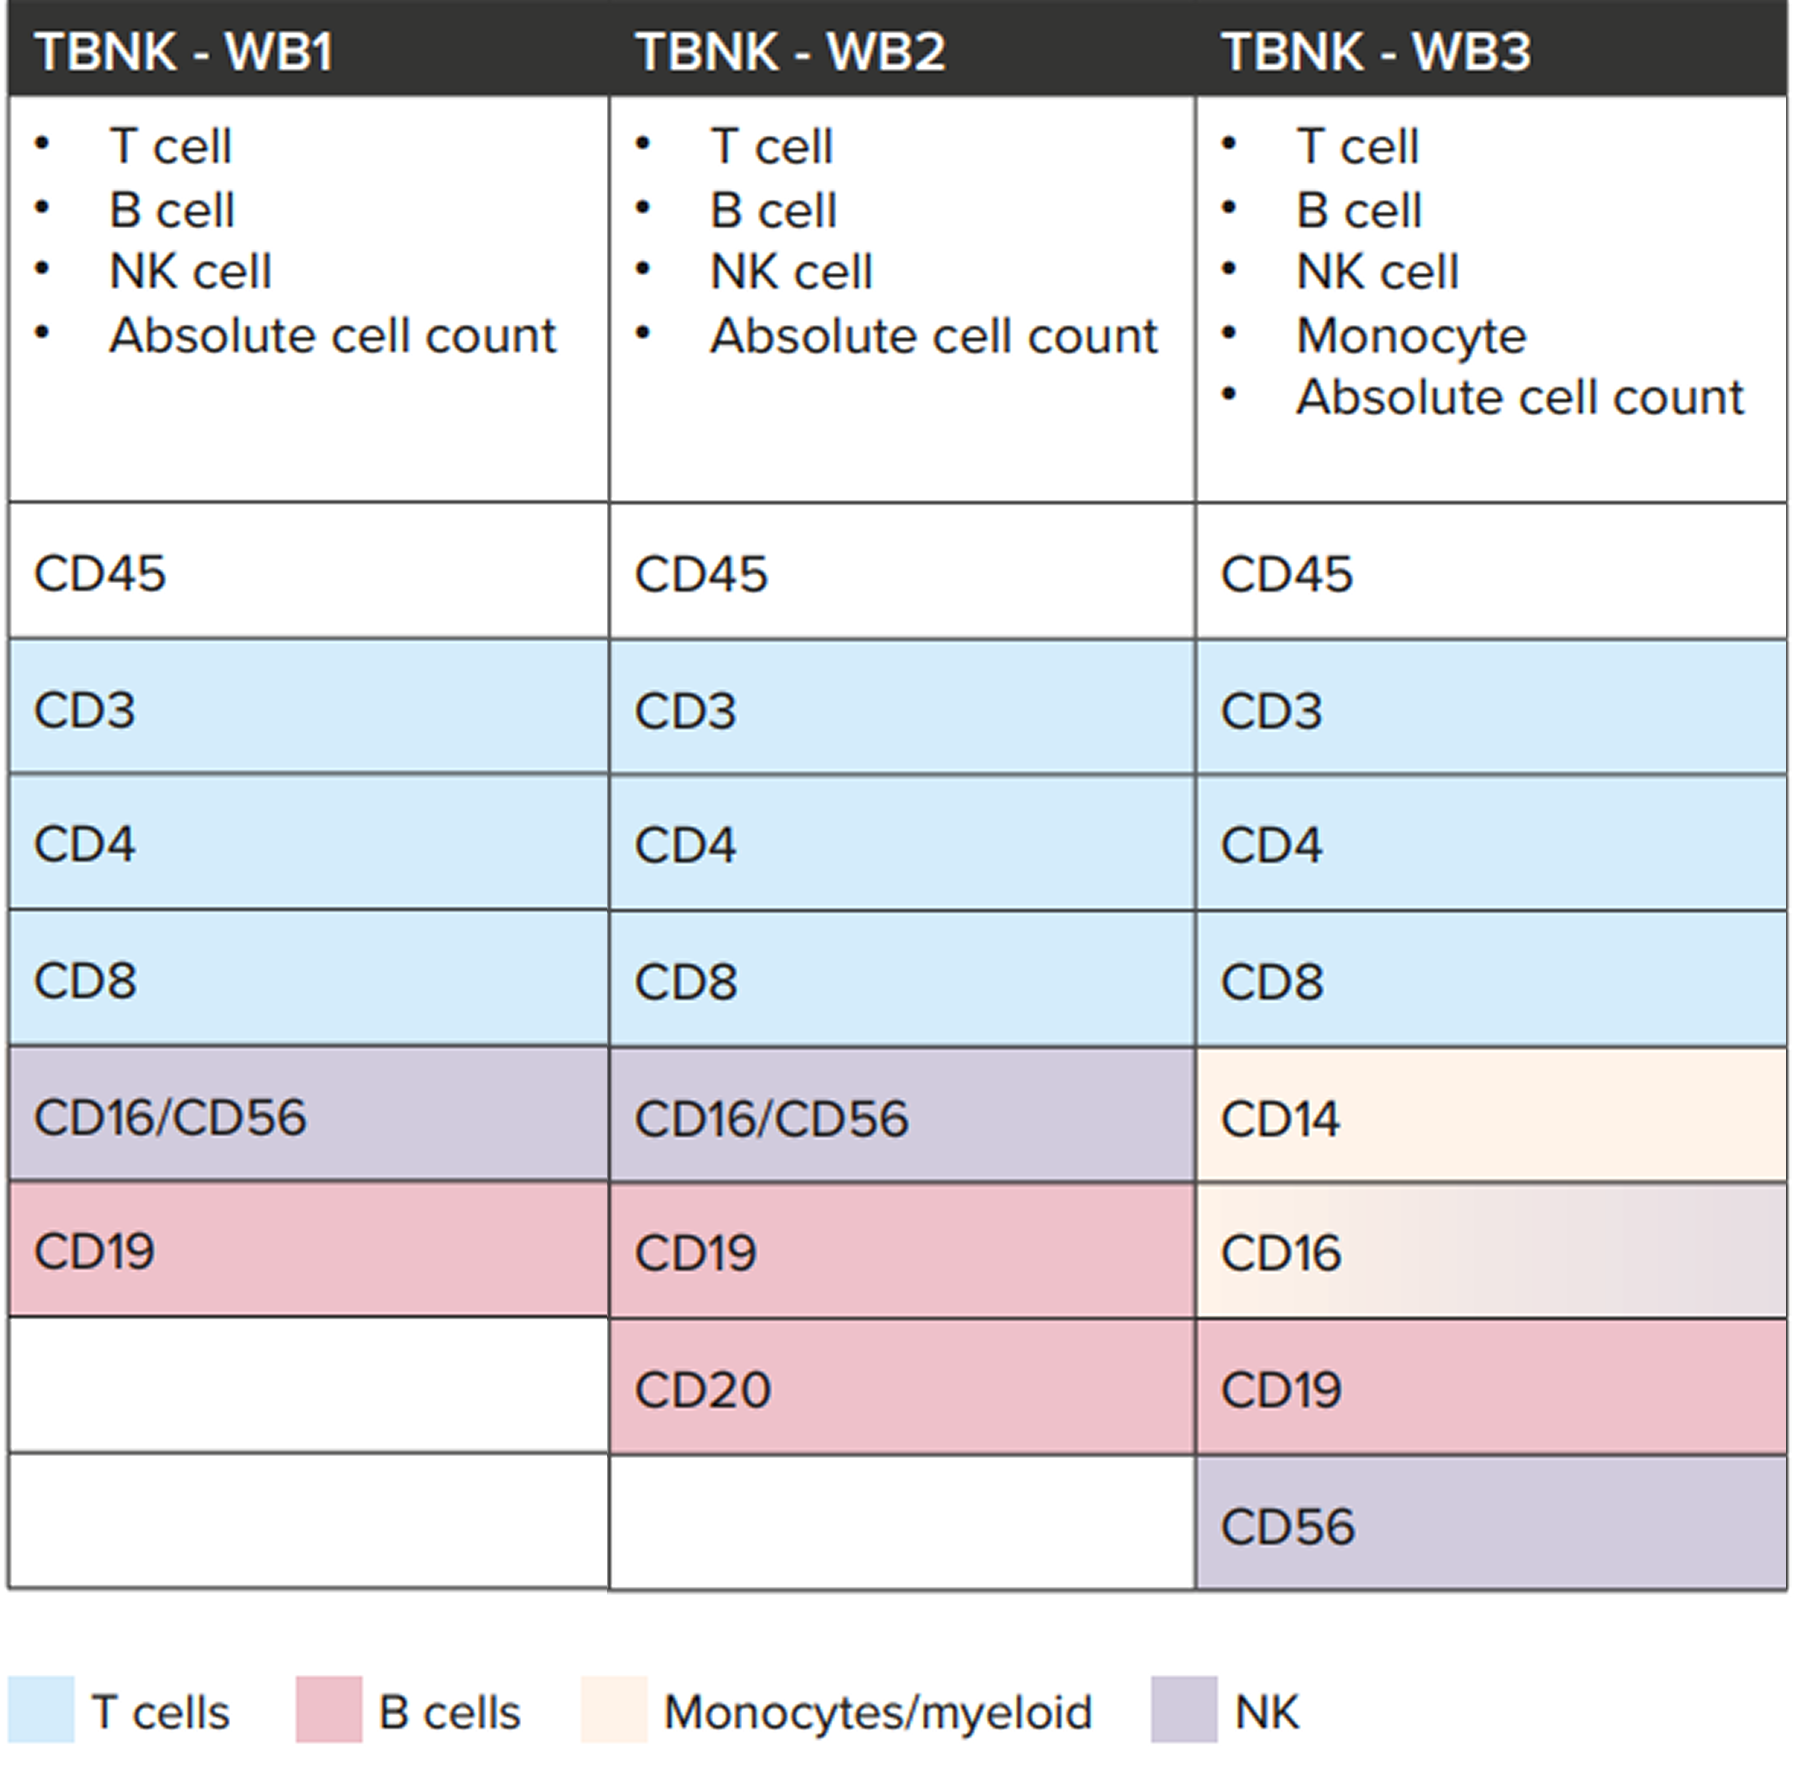
Several OTS TBNK configurations are available, each including a specific set of markers suited to different study objectives (Table 1): 

  • Standard TBNK panel (WB1): includes CD45, CD3, CD4, CD8, CD16/56, and CD19, providing broad coverage of T, B, and NK cells 
  • TBNK + CD20 panel (WB2): incorporates CD20 to better identify B-cell populations  
  • TBNK + monocytes panel (WB3): adds CD14, CD16, and CD56 to extend analysis to monocytes and NK-cell subsets  

These OTS configurations can be used as starting points that can be adapted to accommodate a vast range of specific research or clinical needs. Additional markers may be introduced to capture other immune populations, provided the panel size is kept small enough to remain compatible with the lyse/no-wash protocol.


Table 1Overview of CellCarta’s OTS TBNK panel configurations and marker composition. Each configuration can be further adapted with additional markers as required, within the limits of the lyse/no-wash protocol. 

Our standard TBNK panel (TBNK 1) has IVD status (when used according to the manufacturer’s specifications), making it suitable for use in regulatory submissions. Our other non-IVD panels are validated internally to the same rigorous standard and can be deployed to inform clinical decisions, such as patient onboarding or healthy donor release criteria. 

The absolute counts reported from the TBNK enumeration panels provide stand-alone values that enable direct comparison across studies and support consistent tracking of immune populations. Additionally, to support timely decision-making, CellCarta’s standardized TBNK workflows enable official reporting within five days, providing the speed required for responsive immune monitoring.  

Together, these measures ensure that CellCarta’s TBNK panels deliver high-quality, reproducible data that strengthens confidence in immune profiling results. 

Enable reliable results across TBNK assays 

Selecting the right TBNK panel depends on understanding how therapeutic target study goals, and clinical context shape immune monitoring requirements. Meeting those varied requirements calls for proven expertise in both assay development and implementation.  

Backed by deep experience in flow cytometry and assay validation, CellCarta can perform TBNK assays that combine reproducible performance, cross-site consistency, and efficient reporting. 

To find out more about how CellCarta’s TBNK panel expertise can support your research, talk to one of our experts.


About the author:

author photo

Céline Vandamme is a Scientific Business Director at CellCarta, specializing in the flow cytometry platform. With a PhD in immunology, and a broad expertise gained through her work at various academic and pharmaceutical institutions, Céline has profuse experience in designing flow cytometry assays to support immune monitoring activities in clinical trials.

TBNK Panels: How To Select the Optimal One

November 25, 2025

Flow cytometry–based TBNK panels are a mainstay of immune profiling, used to accurately enumerate T cells, B cells, and natural killer (NK) cells for a range of clinical purposes. Using the right TBNK panel configuration is essential for generating relevant results that support confident clinical decision-making, but identifying the most suitable option can be challenging.  

In this blog, we explore the key factors that influence TBNK panel selection and the importance of validated, standardized approaches in generating valuable immune profiling data

Why use a TBNK panel 

Accurate immune profiling is central to understanding the processes that influence how patients will respond to therapeutic interventions, and the reliability of those insights depends on consistent measurement of key lymphocyte populations. TBNK panels provide a standardized framework for generating that data, allowing immune responses to be compared across time points, patients, or clinical sites.  

By staining blood samples with antibodies that recognize cell surface markers, typically including CD3, CD4, CD8, CD19, and CD16/56, TBNK panels provide a high-level quantitative overview of a patient’s immune composition. Because different studies may focus on different immune subsets or endpoints, there are multiple TBNK panel configurations you can choose from. Each panel configuration provides distinct insights, and selecting the appropriate one ensures that the data generated is relevant and interpretable within the clinical context. 

How do you choose the right TBNK panel? 

Several factors influence which TBNK panel configuration is most appropriate for a given study or clinical application. 

Therapeutic target 

When and how a TBNK panel is deployed is largely determined by the type of therapy being investigated. Currently, TBNK analysis is most often used to track B-cell aplasia or T-cell expansion and contraction, applications that are particularly relevant to CAR-T and T-cell engager (TCE) therapies targeting B cells.  

Once the decision is made to use a TBNK assay, panel design is guided by the therapeutic target and the immune cell populations most relevant to the study. Standard off-the-shelf (OTS) configurations are often used as a foundation, but these can be adapted to specific study questions with additional markers.  

Regulatory and clinical context 

If data is to be included in regulatory submissions, an assay with the appropriate validation or IVD certification should be used to ensure compliance and data integrity. Other panel configurations may be validated for use in clinical settings, where they can support applications such as defining secondary endpoints or establishing patient onboarding and exclusion criteria.  

Turnaround time and workflow 

For clinical decision-making, rapid and standardized data delivery is also a key factor. An off-the-shelf, validated TBNK workflow allows for efficient processing and official reporting, enabling timely decisions such as the release of healthy donors based on B-cell repopulation following anti-B-cell therapy. 

Validated TBNK Panels from CellCarta 

Whatever your specific needs, CellCarta offers a portfolio of validated TBNK flow cytometry panels. Each panel has been validated in-house and cross-validated across CellCarta’s global sites to confirm reproducible performance between laboratories, with emphasis given to stability testing to ensure consistent performance over time. .  

Several OTS TBNK configurations are available, each including a specific set of markers suited to different study objectives (Table 1): 

  • Standard TBNK panel (WB1): includes CD45, CD3, CD4, CD8, CD16/56, and CD19, providing broad coverage of T, B, and NK cells 
  • TBNK + CD20 panel (WB2): incorporates CD20 to better identify B-cell populations  
  • TBNK + monocytes panel (WB3): adds CD14, CD16, and CD56 to extend analysis to monocytes and NK-cell subsets  

These OTS configurations can be used as starting points that can be adapted to accommodate a vast range of specific research or clinical needs. Additional markers may be introduced to capture other immune populations, provided the panel size is kept small enough to remain compatible with the lyse/no-wash protocol.


Table 1Overview of CellCarta’s OTS TBNK panel configurations and marker composition. Each configuration can be further adapted with additional markers as required, within the limits of the lyse/no-wash protocol. 

Our standard TBNK panel (TBNK 1) has IVD status (when used according to the manufacturer’s specifications), making it suitable for use in regulatory submissions. Our other non-IVD panels are validated internally to the same rigorous standard and can be deployed to inform clinical decisions, such as patient onboarding or healthy donor release criteria. 

The absolute counts reported from the TBNK enumeration panels provide stand-alone values that enable direct comparison across studies and support consistent tracking of immune populations. Additionally, to support timely decision-making, CellCarta’s standardized TBNK workflows enable official reporting within five days, providing the speed required for responsive immune monitoring.  

Together, these measures ensure that CellCarta’s TBNK panels deliver high-quality, reproducible data that strengthens confidence in immune profiling results. 

Enable reliable results across TBNK assays 

Selecting the right TBNK panel depends on understanding how therapeutic target study goals, and clinical context shape immune monitoring requirements. Meeting those varied requirements calls for proven expertise in both assay development and implementation.  

Backed by deep experience in flow cytometry and assay validation, CellCarta can perform TBNK assays that combine reproducible performance, cross-site consistency, and efficient reporting. 

To find out more about how CellCarta’s TBNK panel expertise can support your research, talk to one of our experts.


About the author:

author photo

Céline Vandamme is a Scientific Business Director at CellCarta, specializing in the flow cytometry platform. With a PhD in immunology, and a broad expertise gained through her work at various academic and pharmaceutical institutions, Céline has profuse experience in designing flow cytometry assays to support immune monitoring activities in clinical trials.

This is SPARTA: A Framework for Multiplex Immunofluorescence Analysis

November 13, 2025

What is spatial biology? 

Understanding how cells interact in their native context is critical for the development of novel therapeutics and effective diagnostics. Conventional assays or single-cell approaches often miss this layer of information, either by averaging signals across the tissue or by removing cells from their tissue environment. Spatial biology, on the other hand, preserves tissue architecture, allowing researchers to study cell type, location, and interaction together to reveal a more complete picture of disease biology.  

The value of spatial biology  

Spatial biology provides researchers with insights that can directly inform therapeutic development and translational decision-making. By combining cellular detail with spatial context, it enables teams to: 

  • Map the tissue microenvironment to understand how e.g. immune, stromal, and cancer cells shape disease progression 
  • Identify new therapeutic targets and validate them in situ, rather than in dissociated systems 
  • Pinpoint mechanisms of treatment response or resistance by showing how spatial relationships can influence therapeutic effects, giving insight into why patients with seemingly similar profiles can respond differently 
  • Strengthen biomarker discovery and validation by identifying spatial patterns that correlate with clinical outcomes 

Spatial biology methods generate exceptionally rich datasets that capture multiple layers of tissue complexity. One of the more common spatial biology approaches is multiplex immunofluorescence (mIF), which enables multiple markers to be visualized on a single tissue section. While these datasets bring enormous value, their size and complexity can make them difficult to interpret. When multiple imaging platforms are in use, workflows can become fragmented, and researchers risk generating data that cannot easily be integrated, slowing discovery and translation. 

Realizing the full value of spatial biology requires standardized multiplex immunofluorescence protocols and structured workflows that can handle complex datasets and deliver clear, interpretable insights.  

SPARTA: Bringing order to spatial biology  

To simplify mIF workflows, CellCarta developed SPARTA (Spatial Phenotyping and Analysis in Regions of Tissue with AI)—a platform-agnostic framework that standardizes how datasets are processed and analyzed across imaging systems.  

SPARTA incorporates:  

  • Whole-slide imaging and QC across multiple platforms (Lunaphore Comet, Akoya PhenoImager, and Zeiss Axioscan Z1), offering flexibility and shorter lead times  
  • Segmentation and classification, using expert-designed, AI-enabled algorithms for segmentation, followed by single-cell feature extraction and rule-based classification 
  • Data export and advanced analytics, including summary outputs (densities, proportions), object-based single-cell data with coordinates, and advanced analyses such as supervised/unsupervised phenotyping, proximity analysis, and cell neighborhood mapping 
  • Custom data delivery that avoids generic “data dumps,” providing instead tailored insights aligned with specific research questions  

By combining platform flexibility, advanced analytics, and tailored reporting, the SPARTA framework ensures that data from different platforms is processed consistently, so researchers can more easily extract meaningful patterns from complex datasets.

Drive discovery with spatial biology  

By revealing the organization of complex tissue environments and capturing cellular interactions, spatial biology continues to provide critical insights that shape drug development. mIF makes it possible to generate rich, multi-dimensional datasets that inform preclinical research and translational decisions. With structured workflows like SPARTA, supported by strong expertise and collaborations across assay development, pathology, imaging, and data science teams, this data can be transformed into tailored outputs that can help accelerate discovery, strengthen biomarker programs, and support clinical development. 

To find out more about how our SPARTA framework could support your spatial biology workflows, get in touch with one of our experts! 


About the author

author photo

Yannick Waumans is Executive Director of Histopathology Operations at CellCarta, where he oversees the Histopathology Lab Services, Technical Transfer Office, and Digital Pathology Solutions. With a PhD in Pharmaceutical Sciences and over a decade of experience in histopathology, imaging, and image analysis, Yannick is an expert in advancing and operationalizing digital pathology technologies.  

He is especially passionate about leveraging digital pathology to accelerate research and improve clinical outcomes. 

This is SPARTA: A Framework for Multiplex Immunofluorescence Analysis

November 13, 2025

What is spatial biology? 

Understanding how cells interact in their native context is critical for the development of novel therapeutics and effective diagnostics. Conventional assays or single-cell approaches often miss this layer of information, either by averaging signals across the tissue or by removing cells from their tissue environment. Spatial biology, on the other hand, preserves tissue architecture, allowing researchers to study cell type, location, and interaction together to reveal a more complete picture of disease biology.  

The value of spatial biology  

Spatial biology provides researchers with insights that can directly inform therapeutic development and translational decision-making. By combining cellular detail with spatial context, it enables teams to: 

  • Map the tissue microenvironment to understand how e.g. immune, stromal, and cancer cells shape disease progression 
  • Identify new therapeutic targets and validate them in situ, rather than in dissociated systems 
  • Pinpoint mechanisms of treatment response or resistance by showing how spatial relationships can influence therapeutic effects, giving insight into why patients with seemingly similar profiles can respond differently 
  • Strengthen biomarker discovery and validation by identifying spatial patterns that correlate with clinical outcomes 

Spatial biology methods generate exceptionally rich datasets that capture multiple layers of tissue complexity. One of the more common spatial biology approaches is multiplex immunofluorescence (mIF), which enables multiple markers to be visualized on a single tissue section. While these datasets bring enormous value, their size and complexity can make them difficult to interpret. When multiple imaging platforms are in use, workflows can become fragmented, and researchers risk generating data that cannot easily be integrated, slowing discovery and translation. 

Realizing the full value of spatial biology requires standardized multiplex immunofluorescence protocols and structured workflows that can handle complex datasets and deliver clear, interpretable insights.  

SPARTA: Bringing order to spatial biology  

To simplify mIF workflows, CellCarta developed SPARTA (Spatial Phenotyping and Analysis in Regions of Tissue with AI)—a platform-agnostic framework that standardizes how datasets are processed and analyzed across imaging systems.  

SPARTA incorporates:  

  • Whole-slide imaging and QC across multiple platforms (Lunaphore Comet, Akoya PhenoImager, and Zeiss Axioscan Z1), offering flexibility and shorter lead times  
  • Segmentation and classification, using expert-designed, AI-enabled algorithms for segmentation, followed by single-cell feature extraction and rule-based classification 
  • Data export and advanced analytics, including summary outputs (densities, proportions), object-based single-cell data with coordinates, and advanced analyses such as supervised/unsupervised phenotyping, proximity analysis, and cell neighborhood mapping 
  • Custom data delivery that avoids generic “data dumps,” providing instead tailored insights aligned with specific research questions  

By combining platform flexibility, advanced analytics, and tailored reporting, the SPARTA framework ensures that data from different platforms is processed consistently, so researchers can more easily extract meaningful patterns from complex datasets.

Drive discovery with spatial biology  

By revealing the organization of complex tissue environments and capturing cellular interactions, spatial biology continues to provide critical insights that shape drug development. mIF makes it possible to generate rich, multi-dimensional datasets that inform preclinical research and translational decisions. With structured workflows like SPARTA, supported by strong expertise and collaborations across assay development, pathology, imaging, and data science teams, this data can be transformed into tailored outputs that can help accelerate discovery, strengthen biomarker programs, and support clinical development. 

To find out more about how our SPARTA framework could support your spatial biology workflows, get in touch with one of our experts! 


About the author

author photo

Yannick Waumans is Executive Director of Histopathology Operations at CellCarta, where he oversees the Histopathology Lab Services, Technical Transfer Office, and Digital Pathology Solutions. With a PhD in Pharmaceutical Sciences and over a decade of experience in histopathology, imaging, and image analysis, Yannick is an expert in advancing and operationalizing digital pathology technologies.  

He is especially passionate about leveraging digital pathology to accelerate research and improve clinical outcomes. 

Improving RNA-Seq Library Preparation for Accuracy

November 5, 2025

RNA sequencing (RNA-seq) is a critical tool in biomarker discovery and translational research. Its accuracy and efficiency depend heavily on the quality of library preparation, which can affect everything from the number of genes detected to the accuracy and reproducibility of gene abundance estimates. An inadequate workflow at this stage can lead to long preparation times, unreliable data, and, at worst, failed samples.  

When working with valuable clinical material, it is therefore vital to use the most reliable and efficient RNA library preparation method available. At CellCarta, we continuously refine our workflows to deliver the highest-quality data. As part of this commitment, we recently evaluated the Watchmaker Genomics (WMG) RNA-sequencing workflows as an alternative to standard capture RNA-sequencing methods. The Watchmaker workflow reduces preparation time from 16 hours to only 4 hours, all while improving data quality, data yield, and reproducibility. 

Below, we highlight results from our validation study and the advantages Watchmaker Genomics can bring for your RNA-seq workflows.  

Comparing Watchmaker Genomics with standard capture RNA-sequencing

In our validation study, the Watchmaker RNA library prep with Polaris® Depletion was benchmarked directly against the standard RNA capture method. The results showed consistent improvements across multiple performance measures, including duplication rates, mapping rates, and gene detection 

Lower duplication rates  

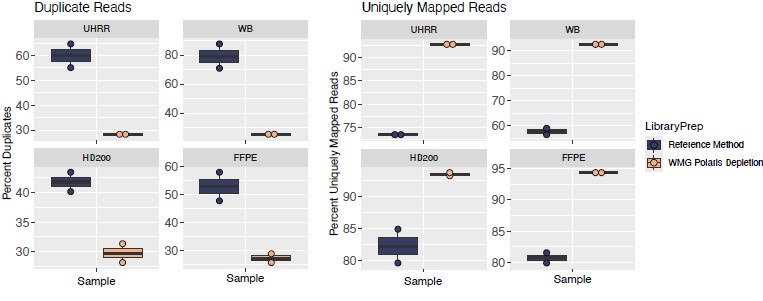
High duplication rates lead to wasted sequencing capacity and can skew gene abundance estimates. With Watchmaker RNA library prep with Polaris Depletion, duplication rates were significantly reduced, and uniquely mapped reads were significantly increased compared to the standard method (Figure 1), resulting in cleaner data, a more efficient use of sequencing resources, and allowing for more reliable biological insights.  

Figure 1: Watchmaker demonstrates a significant reduction in PCR duplication rates and a higher fraction of uniquely mapped reads compared to the standard RNA capture method, independent of sample type. UHRR: universal human reference RNA, WB: whole blood, HD200: Horizon Discovery reference sample, FFPE: formalin-fixed paraffin-embedded, WGM: Watchmaker Genomics.

Efficient depletion of rRNA and globin

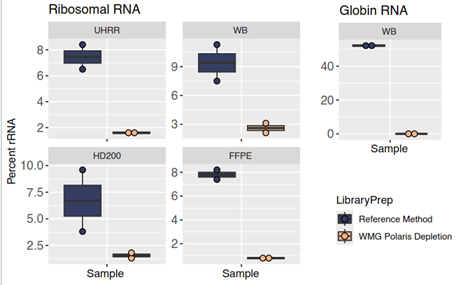
Another area of improvement with Watchmaker RNA library prep with Polaris Depletion was the removal of unwanted RNA species. Poor removal of ribosomal RNA (rRNA) and globin RNA results in fewer reads that map to the biologically informative portion of the transcriptome, thereby negatively impacting sequencing efficiency. In our validation, Watchmaker RNA library prep with Polaris Depletion consistently reduced both rRNA and globin reads in both formalin-fixed paraffin-embedded (FFPE) samples, and whole blood (WB), compared to the standard RNA capture method.

Figure 2: The Watchmaker workflow generated fewer rRNA reads and a reduction in globin reads compared to the standard RNA-seq method.

More detected genes

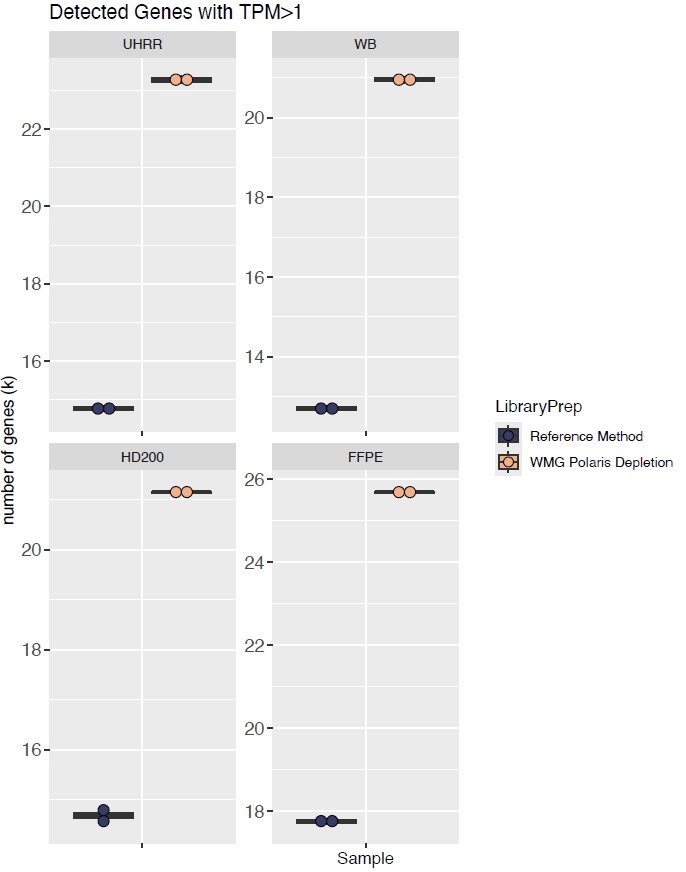
Watchmaker RNA library prep with Polaris Depletion also enabled the detection of 30% more genes across sample types compared with the standard capture method (Figure 3), reflecting the higher proportion of informative reads and allowing deeper coverage of the transcriptome. For researchers, this means richer datasets, stronger biomarker discovery potential, and more confidence in downstream analyses.

Figure 3: Watchmaker libraries consistently detected more genes across sample types compared with the standard RNA capture method. TPM: transcripts per million.

Maximize the value of every sample

Our validation confirmed that the Watchmaker Genomics RNA-seq workflow delivers consistent improvements in duplication rates, gene detection, and reproducibility compared with standard RNA capture methods. For researchers, this means cleaner libraries, richer transcriptome coverage, and greater confidence that they can get meaningful insights from their samples.

Contact us to learn more about how CellCarta can apply the Watchmaker library prep workflow to support your RNA-seq needs.


About the author:

author photo

Pieter Mestdagh is a genomics expert at CellCarta. With a PhD degree in biomedical sciences, and a broad expertise gained through his work in academia and industry, Pieter has broad experience with nucleic acid quantification methods to support DNA and RNA analysis in clinical trials.

Improving RNA-Seq Library Preparation for Accuracy

November 5, 2025

RNA sequencing (RNA-seq) is a critical tool in biomarker discovery and translational research. Its accuracy and efficiency depend heavily on the quality of library preparation, which can affect everything from the number of genes detected to the accuracy and reproducibility of gene abundance estimates. An inadequate workflow at this stage can lead to long preparation times, unreliable data, and, at worst, failed samples.  

When working with valuable clinical material, it is therefore vital to use the most reliable and efficient RNA library preparation method available. At CellCarta, we continuously refine our workflows to deliver the highest-quality data. As part of this commitment, we recently evaluated the Watchmaker Genomics (WMG) RNA-sequencing workflows as an alternative to standard capture RNA-sequencing methods. The Watchmaker workflow reduces preparation time from 16 hours to only 4 hours, all while improving data quality, data yield, and reproducibility. 

Below, we highlight results from our validation study and the advantages Watchmaker Genomics can bring for your RNA-seq workflows.  

Comparing Watchmaker Genomics with standard capture RNA-sequencing

In our validation study, the Watchmaker RNA library prep with Polaris® Depletion was benchmarked directly against the standard RNA capture method. The results showed consistent improvements across multiple performance measures, including duplication rates, mapping rates, and gene detection 

Lower duplication rates  

High duplication rates lead to wasted sequencing capacity and can skew gene abundance estimates. With Watchmaker RNA library prep with Polaris Depletion, duplication rates were significantly reduced, and uniquely mapped reads were significantly increased compared to the standard method (Figure 1), resulting in cleaner data, a more efficient use of sequencing resources, and allowing for more reliable biological insights.  

Figure 1: Watchmaker demonstrates a significant reduction in PCR duplication rates and a higher fraction of uniquely mapped reads compared to the standard RNA capture method, independent of sample type. UHRR: universal human reference RNA, WB: whole blood, HD200: Horizon Discovery reference sample, FFPE: formalin-fixed paraffin-embedded, WGM: Watchmaker Genomics.

Efficient depletion of rRNA and globin

Another area of improvement with Watchmaker RNA library prep with Polaris Depletion was the removal of unwanted RNA species. Poor removal of ribosomal RNA (rRNA) and globin RNA results in fewer reads that map to the biologically informative portion of the transcriptome, thereby negatively impacting sequencing efficiency. In our validation, Watchmaker RNA library prep with Polaris Depletion consistently reduced both rRNA and globin reads in both formalin-fixed paraffin-embedded (FFPE) samples, and whole blood (WB), compared to the standard RNA capture method.

Figure 2: The Watchmaker workflow generated fewer rRNA reads and a reduction in globin reads compared to the standard RNA-seq method.

More detected genes

Watchmaker RNA library prep with Polaris Depletion also enabled the detection of 30% more genes across sample types compared with the standard capture method (Figure 3), reflecting the higher proportion of informative reads and allowing deeper coverage of the transcriptome. For researchers, this means richer datasets, stronger biomarker discovery potential, and more confidence in downstream analyses.

Figure 3: Watchmaker libraries consistently detected more genes across sample types compared with the standard RNA capture method. TPM: transcripts per million.

Maximize the value of every sample

Our validation confirmed that the Watchmaker Genomics RNA-seq workflow delivers consistent improvements in duplication rates, gene detection, and reproducibility compared with standard RNA capture methods. For researchers, this means cleaner libraries, richer transcriptome coverage, and greater confidence that they can get meaningful insights from their samples.

Contact us to learn more about how CellCarta can apply the Watchmaker library prep workflow to support your RNA-seq needs.


About the author:

author photo

Pieter Mestdagh is a genomics expert at CellCarta. With a PhD degree in biomedical sciences, and a broad expertise gained through his work in academia and industry, Pieter has broad experience with nucleic acid quantification methods to support DNA and RNA analysis in clinical trials.