Cytometry Analysis with Customized Autogating by CellEngine CellCarta

December 14, 2022
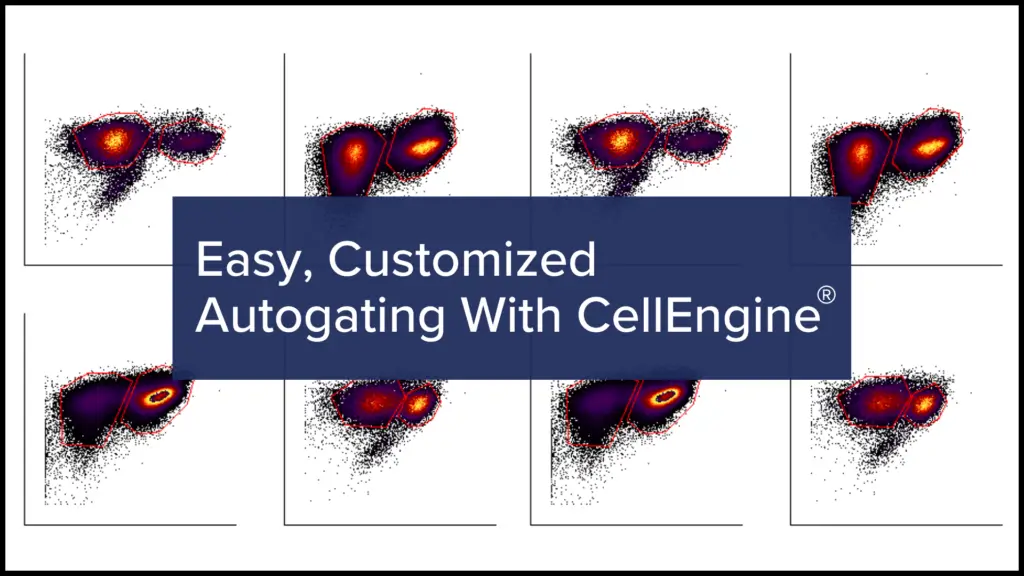
Autogating flow cytometry- customized autogating with cellengine

Ideally during cytometry data analysis, the same gate position is appropriate for every sample in a study. Unfortunately, a lot of factors can cause variability in populations of cells, many of which are unavoidable.

Staining intensity can change due to batch effects, experimental conditions, tissue origin, cytometer performance, or just normal donor variance.

Manually adjusting gates to every sample can be extremely time-consuming, particularly if a study is large or has many markers.

With CellEngine, our next-generation cytometry analysis software, gates can be adjusted automatically, freeing analysts of this burden.

Autogating uses a manually gated training dataset as input, and it applies a machine learning algorithm to adjust the gates to the remainder of the dataset.

The algorithm follows your defined hierarchy, making the output easier to understand than unsupervised analysis methods.

The tool is easy to set up, runs in seconds, and the results are fully reviewable and changeable if needed.

1. Prepare a High-Quality Training Dataset

The training set used by the autogating algorithm is a user-defined subset of files that have been manually gated.

It should include examples from each of the experimental conditions in the study – for instance, both control and experimental samples, or samples from every tissue type.

High-quality training gates mean high-quality output, so a small number of files is usually sufficient, even for large datasets.

2. Organize and Group Files Efficiently for Consistent Gating

Files can be gated individually or in groups, with each file in the group having the same gate geometry.

For example, autogating can be instructed to gate all files for each donor the same way, thereby normalizing comparisons between individuals.

CellEngine conveniently allows defining those sample groups using metadata – in this example, the donor ID.

3. Let CellEngine Autogating Algorithm Customize Gates in Seconds

CellEngine’s autogating feature is designed to rapidly analyze large projects with many parameters. The autogating tool can adjust multiple gates simultaneously, making for a simple workflow.

CellEngine’s software and hardware optimization means that gates can be adjusted to thousands of files in seconds, so autogating is never a bottleneck to the next analysis.

If additional files are added later, autogating can correct gate positions for just those files, allowing for rapid analysis of the new data.

Autogating Easily Fits Into Your Existing Workflows

Gates created by the algorithm use the same 1D and 2D geometric shapes and hierarchy as manual gates. This allows the gates to be viewed like any other.

Furthermore, any gates that need correction can be manually adjusted. This allows autogating to be seamlessly used to supplement existing manual gating steps, so that analysts can spend more time on data interpretation and analysis.

Autogating is just one of many CellEngine features designed to improve flow cytometry analysis, particularly for large and complex experiments.

Sign up for a free two-month trial or contact us for a live demo.


Watch the following video from our expert to learn more


About the author:

author photo

Anita Ray is a technical application specialist with CellEngine. She has ten years of experience in cytometry and worked in translational immuno-oncology prior to joining the CellEngine team.
Cytometry Analysis with Customized Autogating by CellEngine CellCarta

December 14, 2022

Autogating flow cytometry- customized autogating with cellengine

Ideally during cytometry data analysis, the same gate position is appropriate for every sample in a study. Unfortunately, a lot of factors can cause variability in populations of cells, many of which are unavoidable.

Staining intensity can change due to batch effects, experimental conditions, tissue origin, cytometer performance, or just normal donor variance.

Manually adjusting gates to every sample can be extremely time-consuming, particularly if a study is large or has many markers.

With CellEngine, our next-generation cytometry analysis software, gates can be adjusted automatically, freeing analysts of this burden.

Autogating uses a manually gated training dataset as input, and it applies a machine learning algorithm to adjust the gates to the remainder of the dataset.

The algorithm follows your defined hierarchy, making the output easier to understand than unsupervised analysis methods.

The tool is easy to set up, runs in seconds, and the results are fully reviewable and changeable if needed.

1. Prepare a High-Quality Training Dataset

The training set used by the autogating algorithm is a user-defined subset of files that have been manually gated.

It should include examples from each of the experimental conditions in the study – for instance, both control and experimental samples, or samples from every tissue type.

High-quality training gates mean high-quality output, so a small number of files is usually sufficient, even for large datasets.

2. Organize and Group Files Efficiently for Consistent Gating

Files can be gated individually or in groups, with each file in the group having the same gate geometry.

For example, autogating can be instructed to gate all files for each donor the same way, thereby normalizing comparisons between individuals.

CellEngine conveniently allows defining those sample groups using metadata – in this example, the donor ID.

3. Let CellEngine Autogating Algorithm Customize Gates in Seconds

CellEngine’s autogating feature is designed to rapidly analyze large projects with many parameters. The autogating tool can adjust multiple gates simultaneously, making for a simple workflow.

CellEngine’s software and hardware optimization means that gates can be adjusted to thousands of files in seconds, so autogating is never a bottleneck to the next analysis.

If additional files are added later, autogating can correct gate positions for just those files, allowing for rapid analysis of the new data.

Autogating Easily Fits Into Your Existing Workflows

Gates created by the algorithm use the same 1D and 2D geometric shapes and hierarchy as manual gates. This allows the gates to be viewed like any other.

Furthermore, any gates that need correction can be manually adjusted. This allows autogating to be seamlessly used to supplement existing manual gating steps, so that analysts can spend more time on data interpretation and analysis.

Autogating is just one of many CellEngine features designed to improve flow cytometry analysis, particularly for large and complex experiments.

Sign up for a free two-month trial or contact us for a live demo.


Watch the following video from our expert to learn more


About the author:

author photo

Anita Ray is a technical application specialist with CellEngine. She has ten years of experience in cytometry and worked in translational immuno-oncology prior to joining the CellEngine team.
Flow Cytometry Analysis With CellEngine®

October 12, 2022

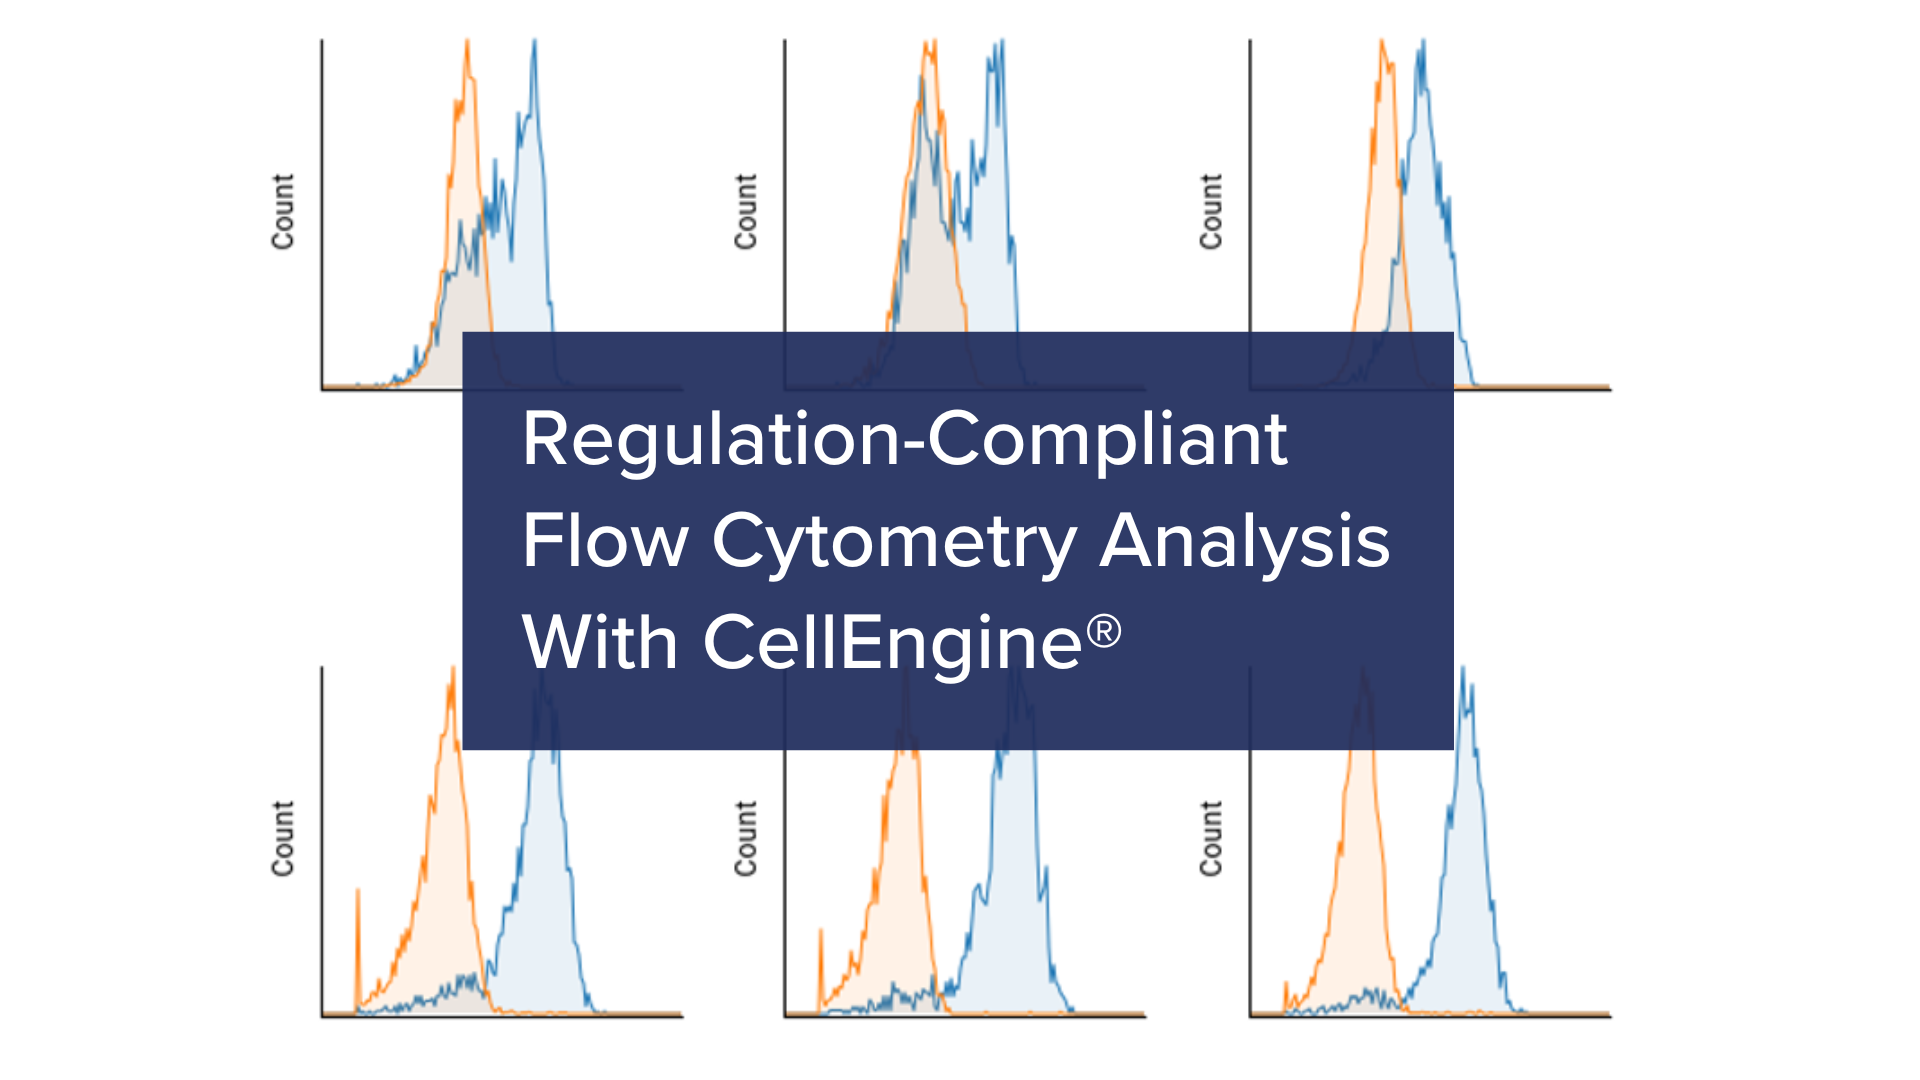
If your research is subject to 21 CFR part 11, EU Annex 11, or equivalent regulations, you may have grappled with designing a regulation-compliant workflow to analyze flow cytometry data. Such regulations establish the required controls over key aspects of data analysis. Most of these requirements can only be met when deliberately designed into the analysis software. CellEngine, a new generation of flow cytometry analysis software, provides all the features required for compliance, allowing for cloud-based analysis that can fully meet regulations.

Capturing Audit Trails

Logging the creation, modification, or deletion of records is an integral part of regulation compliant research. CellEngine allows creating revisions, which are permanent and immutable snapshots of experiments that create a permanent record of analysis at any point. Detailed audit trails are captured, including what work was done, when, and by whom. Append-only comments can also be added to the audit trail, capturing why changes were made.

Personalized Data Access

Only authorized users should be able to complete tasks in compliant workflows, and all users need unique electronic signatures. Data in CellEngine is private by default but can be shared if required. CellEngine’s powerful identity and access management system lets administrators define custom roles comprised of granular permissions. Permissions can be assigned to individuals on specific folders and experiments, defining exactly what users can and cannot do. Access is highly customizable, based on study needs. For example, a reviewer could examine analysis without the ability to make modifications.

Readily Available and Protected Records

Reviewable records are available in both human-readable and electronic forms. CellEngine allows the download of complete experiments via two components: an archive of the FCS files and attachments that were uploaded to the experiment, and a JSON file containing all other aspects of the experiment. Individual aspects of an experiment, including gated populations, plots, illustrations, and statistics, are also downloadable.

CellEngine supports regulatory requirements for records to be protected, accurate, and retrievable by storing duplicate copies of data in geographically separated locations to protect against natural disaster or hardware failure. Users can be restricted from deleting experiments, and retention policies can be set for each experiment to protect against deletion entirely.

Customized Workflow Validation

Regulation-compliant research must validate the accuracy, reliability, and consistency of workflows. CellEngine is the first cytometry analysis platform to offer validation customized to your workflow. Customized test scripting from your cytometer files, analyzed with your process, can be continuously validated. As CellEngine is updated, we can provide validation reports verifying consistency.

Mandatory Training

Users must have the appropriate training to meet regulations. The CellEngine team can assist with training at any stage, including onboarding and follow-up training as needed.

Learn more about CellEngine’s many features designed to improve consistency of flow cytometry analysis, particularly for large and complex experiments.

Sign up for a free two-month trial or contact us for a live demo.


Watch the following video from our expert to learn more


About the author:

author photo

Anita Ray is a technical application specialist with CellEngine. She has ten years of experience in cytometry and worked in translational immuno-oncology prior to joining the CellEngine team.

Flow Cytometry Analysis With CellEngine®

October 12, 2022

If your research is subject to 21 CFR part 11, EU Annex 11, or equivalent regulations, you may have grappled with designing a regulation-compliant workflow to analyze flow cytometry data. Such regulations establish the required controls over key aspects of data analysis. Most of these requirements can only be met when deliberately designed into the analysis software. CellEngine, a new generation of flow cytometry analysis software, provides all the features required for compliance, allowing for cloud-based analysis that can fully meet regulations.

Capturing Audit Trails

Logging the creation, modification, or deletion of records is an integral part of regulation compliant research. CellEngine allows creating revisions, which are permanent and immutable snapshots of experiments that create a permanent record of analysis at any point. Detailed audit trails are captured, including what work was done, when, and by whom. Append-only comments can also be added to the audit trail, capturing why changes were made.

Personalized Data Access

Only authorized users should be able to complete tasks in compliant workflows, and all users need unique electronic signatures. Data in CellEngine is private by default but can be shared if required. CellEngine’s powerful identity and access management system lets administrators define custom roles comprised of granular permissions. Permissions can be assigned to individuals on specific folders and experiments, defining exactly what users can and cannot do. Access is highly customizable, based on study needs. For example, a reviewer could examine analysis without the ability to make modifications.

Readily Available and Protected Records

Reviewable records are available in both human-readable and electronic forms. CellEngine allows the download of complete experiments via two components: an archive of the FCS files and attachments that were uploaded to the experiment, and a JSON file containing all other aspects of the experiment. Individual aspects of an experiment, including gated populations, plots, illustrations, and statistics, are also downloadable.

CellEngine supports regulatory requirements for records to be protected, accurate, and retrievable by storing duplicate copies of data in geographically separated locations to protect against natural disaster or hardware failure. Users can be restricted from deleting experiments, and retention policies can be set for each experiment to protect against deletion entirely.

Customized Workflow Validation

Regulation-compliant research must validate the accuracy, reliability, and consistency of workflows. CellEngine is the first cytometry analysis platform to offer validation customized to your workflow. Customized test scripting from your cytometer files, analyzed with your process, can be continuously validated. As CellEngine is updated, we can provide validation reports verifying consistency.

Mandatory Training

Users must have the appropriate training to meet regulations. The CellEngine team can assist with training at any stage, including onboarding and follow-up training as needed.

Learn more about CellEngine’s many features designed to improve consistency of flow cytometry analysis, particularly for large and complex experiments.

Sign up for a free two-month trial or contact us for a live demo.


Watch the following video from our expert to learn more


About the author:

author photo

Anita Ray is a technical application specialist with CellEngine. She has ten years of experience in cytometry and worked in translational immuno-oncology prior to joining the CellEngine team.

Monitoring MDSC – A Hurdle to Immune Checkpoints Inhibitors

November 9, 2020

Monitoring MDSC – A Hurdle to Immune Checkpoints Inhibitors

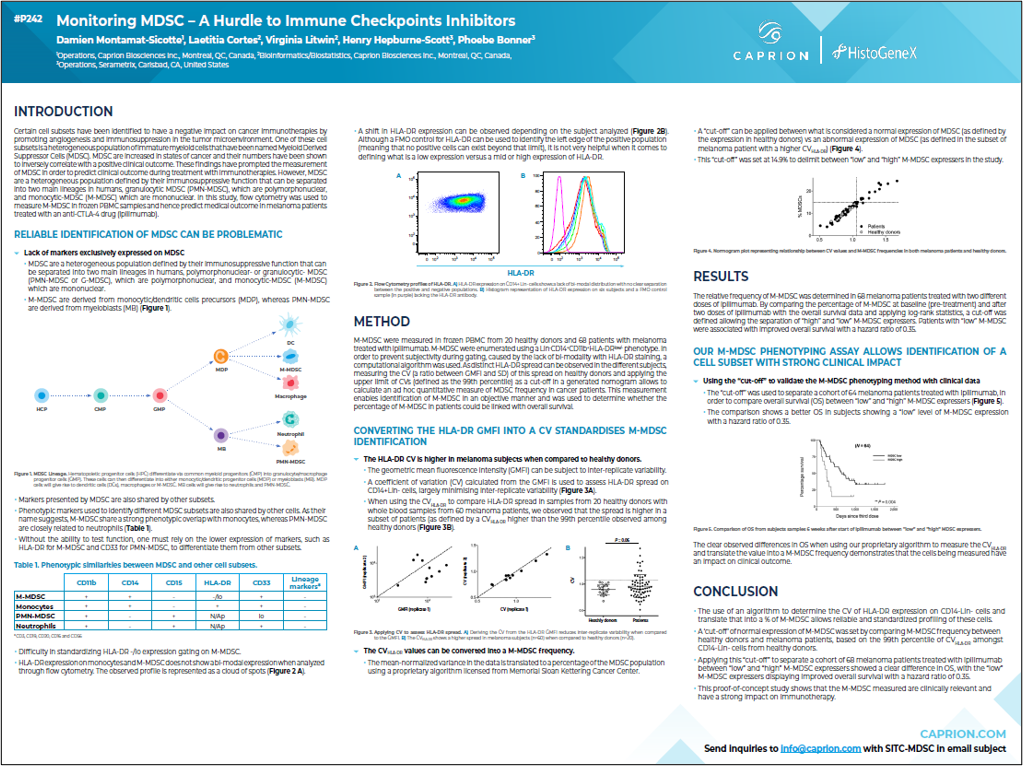
CellCarta’s poster discusses the challenges of monitoring myeloid-derived suppressor cells (MDSCs), which can hinder the effectiveness of immune checkpoint inhibitors.

The study introduces a standardized method for identifying MDSCs using HLA-DR expression levels to distinguish between low and high MDSC populations. This approach was validated in a clinical study with melanoma patients undergoing pembrolizumab treatment, showing a correlation between high MDSC levels and reduced survival rates.

The MDSC phenotyping assay developed by CellCarta offers a reliable tool for assessing MDSC impact on immunotherapy and improving treatment strategies.

As presented in SITC 2020

Capion_Poster_SITC_MDSC

Monitoring MDSC – A Hurdle to Immune Checkpoints Inhibitors

November 9, 2020

Monitoring MDSC – A Hurdle to Immune Checkpoints Inhibitors

CellCarta’s poster discusses the challenges of monitoring myeloid-derived suppressor cells (MDSCs), which can hinder the effectiveness of immune checkpoint inhibitors.

The study introduces a standardized method for identifying MDSCs using HLA-DR expression levels to distinguish between low and high MDSC populations. This approach was validated in a clinical study with melanoma patients undergoing pembrolizumab treatment, showing a correlation between high MDSC levels and reduced survival rates.

The MDSC phenotyping assay developed by CellCarta offers a reliable tool for assessing MDSC impact on immunotherapy and improving treatment strategies.

As presented in SITC 2020

Capion_Poster_SITC_MDSC

Validated Flow Cytometry for Monitoring Multiple Myeloma

November 9, 2020

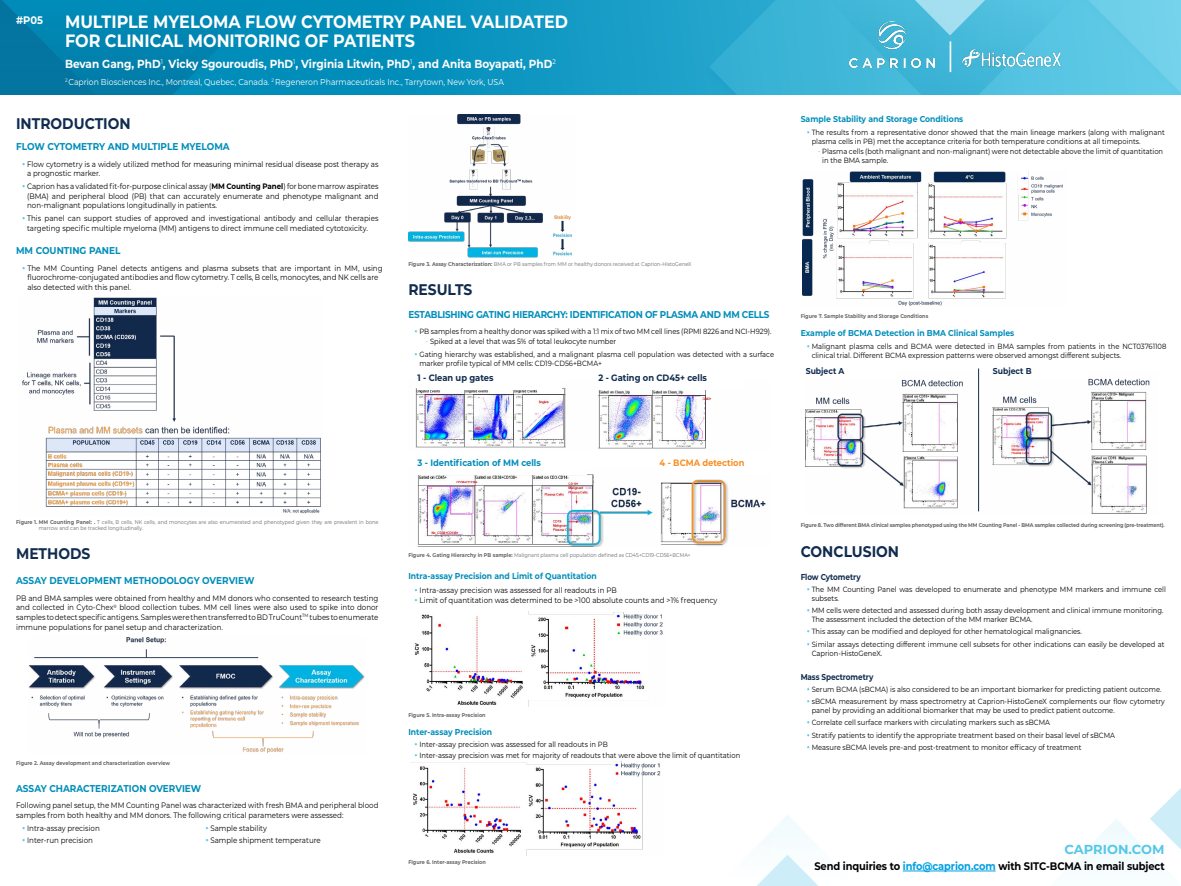
CellCarta’s poster presents a validated flow cytometry panel for the clinical monitoring of multiple myeloma (MM) patients. The MM Counting Panel detects and phenotypes malignant and non-malignant plasma cells, T cells, B cells, monocytes, and NK cells using fluorochrome-conjugated antibodies.

Key Features of the MM Counting Panel:

  • Detection and Enumeration: Accurately enumerates immune populations in bone marrow aspirates (BMA) and peripheral blood (PB).
  • Phenotyping: Identifies specific MM markers, including BCMA, using a surface marker profile (CD19-CD56+BCMA+).
  • Intra- and Inter-assay Precision: Demonstrated high precision with PB samples from both healthy and MM donors, ensuring reliability of results.
  • Sample Stability: Maintained stability and met acceptance criteria for key markers across different temperature conditions and time points.
  • Clinical Validation: Validated with clinical samples from the NCT03761108 trial, showing different BCMA expression patterns among subjects.
  • sBCMA measurement by mass spectrometry can be used as a complementary method for biomarker monitoring.

Assay Development and Characterization:

  • Sample Collection and Preparation: PB and BMA samples were obtained from healthy and MM donors, processed in Cyto-Chex® blood collection tubes, and analyzed using BD TruCount™ tubes.
  • Gating Hierarchy: Established for the identification of malignant plasma cells, with a specific focus on CD45+CD19-CD56+BCMA+ populations.

Conclusion: The MM Counting Panel, validated for clinical use, allows for robust and reliable monitoring of multiple myeloma patients. This comprehensive approach combines flow cytometry and mass spectrometry to enhance the detection of key biomarkers, supporting the development of novel therapies and optimizing treatment outcomes.

Multiple Myeloma Flow Cytometry Panel Validated for Clinical Monitoring of Patients

As presented in SITC 2020

Capion_Poster_SITC_BCMAflow

Validated Flow Cytometry for Monitoring Multiple Myeloma

November 9, 2020

CellCarta’s poster presents a validated flow cytometry panel for the clinical monitoring of multiple myeloma (MM) patients. The MM Counting Panel detects and phenotypes malignant and non-malignant plasma cells, T cells, B cells, monocytes, and NK cells using fluorochrome-conjugated antibodies.

Key Features of the MM Counting Panel:

  • Detection and Enumeration: Accurately enumerates immune populations in bone marrow aspirates (BMA) and peripheral blood (PB).
  • Phenotyping: Identifies specific MM markers, including BCMA, using a surface marker profile (CD19-CD56+BCMA+).
  • Intra- and Inter-assay Precision: Demonstrated high precision with PB samples from both healthy and MM donors, ensuring reliability of results.
  • Sample Stability: Maintained stability and met acceptance criteria for key markers across different temperature conditions and time points.
  • Clinical Validation: Validated with clinical samples from the NCT03761108 trial, showing different BCMA expression patterns among subjects.
  • sBCMA measurement by mass spectrometry can be used as a complementary method for biomarker monitoring.

Assay Development and Characterization:

  • Sample Collection and Preparation: PB and BMA samples were obtained from healthy and MM donors, processed in Cyto-Chex® blood collection tubes, and analyzed using BD TruCount™ tubes.
  • Gating Hierarchy: Established for the identification of malignant plasma cells, with a specific focus on CD45+CD19-CD56+BCMA+ populations.

Conclusion: The MM Counting Panel, validated for clinical use, allows for robust and reliable monitoring of multiple myeloma patients. This comprehensive approach combines flow cytometry and mass spectrometry to enhance the detection of key biomarkers, supporting the development of novel therapies and optimizing treatment outcomes.

Multiple Myeloma Flow Cytometry Panel Validated for Clinical Monitoring of Patients

As presented in SITC 2020

Capion_Poster_SITC_BCMAflow

ELISpot vs ICS Assays: Perfect Method in Immuno-Oncology Trials

October 29, 2020

Section image

Get a clear understanding of the ELISpot and ICS assays along with key elements to consider for the selection of the appropriate method to investigate your vaccine’s efficacy.

Key takeaways from this webinar:

  • Advantages and limitations of ICS and ELISpot for clinical trials
  • How to design ICS and ELISpot assays for maximal data gathering
  • Critical development and validation approaches to consider with ICS and ELISpot assays in order to fulfill regulatory requirements

To access this webinar, contact us.

Efficacy in a vaccine trial is assessed through the production of protective antibodies against the infectious agent.  Measurement of the neutralizing effect of these antibodies is performed through cell-based assays.

Over the past years, additional assays have been introduced in vaccine trials in order to get a better understanding of the vaccine’s mode of action on the immune system.

These assays allow for the monitoring of T-cell responses in subjects upon vaccination, including the humoral response (supported by CD4 helper T cells) and the elimination of infected cells by CD8 cytotoxic T cells (cellular response).

The mechanism can be further characterized through the profiling of the CD4 T cell polarization: Th1, Th2, Th17 and/or follicular helper T cells (Tfh), all of which can have an impact on the resulting therapeutic effect.

Flow cytometry and multimer detection can be used to follow an antigen specific T-cell response and reveal a specific TCR. However, this method allows to follow only one antigen and the functional state (effector/anergic) of the cells remains unknown.

Given these limitations, most trials now employ ELISpot and ICS to reveal both the antigen-specificity and the functionality of the immune response induced by the treatment.

Performing both ELISpot and ICS assays requires a lot of starting material (PBMC isolated from whole blood), which might not be accessible. The question then arises: which method to use? ELISpot or ICS?

On one hand, the ELISpot is commonly considered more sensitive than the ICS assay while requiring less amount of PBMC.

On the other hand, the ICS allows for the measurement of cytokines as well as surface and intracellular markers to generate a more complete cellular profile but consumes more of the precious PBMC material.

During this webinar, we will present:

(a) characteristics of both methods as well as their advantages and limitations

(b) approaches to define optimal assay conditions during development for robust assay performance and maximal data gathering

(c) validation approaches based on intended use of the data

(d) how to deploy these assays using appropriate criteria for control and study samples during sample analysis in infectious diseases (i.e., COVID-19) and immuno-oncology vaccine trials.

ELISpot vs ICS Assays: Perfect Method in Immuno-Oncology Trials

October 29, 2020

Section image

Get a clear understanding of the ELISpot and ICS assays along with key elements to consider for the selection of the appropriate method to investigate your vaccine’s efficacy.

Key takeaways from this webinar:

  • Advantages and limitations of ICS and ELISpot for clinical trials
  • How to design ICS and ELISpot assays for maximal data gathering
  • Critical development and validation approaches to consider with ICS and ELISpot assays in order to fulfill regulatory requirements

To access this webinar, contact us.

Efficacy in a vaccine trial is assessed through the production of protective antibodies against the infectious agent.  Measurement of the neutralizing effect of these antibodies is performed through cell-based assays.

Over the past years, additional assays have been introduced in vaccine trials in order to get a better understanding of the vaccine’s mode of action on the immune system.

These assays allow for the monitoring of T-cell responses in subjects upon vaccination, including the humoral response (supported by CD4 helper T cells) and the elimination of infected cells by CD8 cytotoxic T cells (cellular response).

The mechanism can be further characterized through the profiling of the CD4 T cell polarization: Th1, Th2, Th17 and/or follicular helper T cells (Tfh), all of which can have an impact on the resulting therapeutic effect.

Flow cytometry and multimer detection can be used to follow an antigen specific T-cell response and reveal a specific TCR. However, this method allows to follow only one antigen and the functional state (effector/anergic) of the cells remains unknown.

Given these limitations, most trials now employ ELISpot and ICS to reveal both the antigen-specificity and the functionality of the immune response induced by the treatment.

Performing both ELISpot and ICS assays requires a lot of starting material (PBMC isolated from whole blood), which might not be accessible. The question then arises: which method to use? ELISpot or ICS?

On one hand, the ELISpot is commonly considered more sensitive than the ICS assay while requiring less amount of PBMC.

On the other hand, the ICS allows for the measurement of cytokines as well as surface and intracellular markers to generate a more complete cellular profile but consumes more of the precious PBMC material.

During this webinar, we will present:

(a) characteristics of both methods as well as their advantages and limitations

(b) approaches to define optimal assay conditions during development for robust assay performance and maximal data gathering

(c) validation approaches based on intended use of the data

(d) how to deploy these assays using appropriate criteria for control and study samples during sample analysis in infectious diseases (i.e., COVID-19) and immuno-oncology vaccine trials.