April 16, 2025
Our team developed a comprehensive suite of precision assays to support every stage of antibody-drug conjugate (ADC) development.
From confirming target expression and measuring density, to evaluating drug-target engagement, pharmacokinetics, and safety, CellCarta employs a data-driven, multiplatform approach.
Our solutions include multiplex IF and IHC, flow cytometry, mass spectrometry, RNA sequencing, and spatial biology technologies, ensuring precise target quantification and in-depth tumor microenvironment analysis.
With global facilities, companion diagnostic (CDx) expertise, and full logistics support, CellCarta helps biopharma partners accelerate their ADC programs.

Advance your ADC programs with CellCarta! Contact us today to discover how our precision assays and scientific expertise can drive your clinical success.
April 16, 2025
Our team developed a comprehensive suite of precision assays to support every stage of antibody-drug conjugate (ADC) development.
From confirming target expression and measuring density, to evaluating drug-target engagement, pharmacokinetics, and safety, CellCarta employs a data-driven, multiplatform approach.
Our solutions include multiplex IF and IHC, flow cytometry, mass spectrometry, RNA sequencing, and spatial biology technologies, ensuring precise target quantification and in-depth tumor microenvironment analysis.
With global facilities, companion diagnostic (CDx) expertise, and full logistics support, CellCarta helps biopharma partners accelerate their ADC programs.
Advance your ADC programs with CellCarta! Contact us today to discover how our precision assays and scientific expertise can drive your clinical success.
November 19, 2024
In clinical development, understanding how the immune response evolves upon administration of a therapeutics is often vital to assess safety and/or efficacy. While researchers have traditionally focussed primarily on humoral immunity through assessment of antibody production, the evaluation of cellular immunity has become increasingly important, driven by the need to understand both arms of the adaptive immune system. ELISpot and intracellular cytokine staining (ICS) are key functional assays used to measure the T cell immune responses in clinical trials. Understanding these techniques and selecting the most appropriate one for your application helps you generate the reliable immune response data you need for clinical development and approval.
While both assays are similar in terms of stimulation protocol (e.g: pools of overlapping peptides to stimulate T cells), they each measure immune responses in a distinct way:
Both ICS and ELISpot require cryopreserved peripheral blood mononuclear cells (PBMCs) as a starting point. High-quality PBMC isolation is therefore critical for maintaining cell viability and ensuring reliable results in both assays. Table 1 below shows a side-by-side comparison of other key similarities and differences between each method to guide your assay selection.
Table 1: Comparison of ICS and ELISpot assays.
| Technique | ICS | ELISpot |
|---|---|---|
| Analyte | Intracellular | Secreted/Membrane spot |
| Matrix | PBMC | PBMC |
| Cell # per well | 1-2 x 10^6 | 0.1-0.5 x 10^6 |
| Clinical endpoint and clinical phase | • Exploratory, secondary, primary • All clinical phases |
• Exploratory, secondary, primary • All clinical phases |
| Complexity level | ||
| Assay development/validation | High | High |
| Pre-analytical variables | Mid | High |
| Assay background | Mid | High |
| Data analysis | High | Low |
| Measurements | • Multiple cytokines • Cellular phenotype |
• Individual cytokine in separate assay |
| Multiplexing capability | High level: 16 color panel (conventional cytometry), 30+ color panel (spectral/CyTOF) | Singleplex (possible to multiplex with Fluorospot) |
| Sensitivity | Similar | Similar |
One of the key factors to consider when choosing between ELISpot and ICS is the level of detail required for immune response monitoring. Both assays offer unique advantages for different research goals.
ELISpot is ideal for measuring one or two cytokines at the single cell level. While it cannot identify which specific immune cells are producing the cytokines, ELISpot’s high sensitivity and simplicity of readout make it well suited for trials focused on specific immune markers. The sensitivity is, however, highly dependent on the quality of PBMCs.
ICS is best suited to research aiming to understand the phenotype of cytokine-producing cells and explore complex immune responses such as polyfunctionality. With its ability to multiplex—measuring several cytokines simultaneously—and provide detailed information about the cell types involved, ICS is particularly valuable in trials where you suspect the immune response may vary depending on the circumstances (e.g. switch of responding memory population during treatment or heterogenous disease etiology).
ELISpot and ICS assays can be combined in a two-step strategy to deeply characterize immune responses in a selection of clinical trial samples. In this perspective, the ELISpot assay can first be used as a screening tool to assess uncharacterized samples and define the ones (subjects/timepoints) that warrant further investigation to support clinical development. A comprehensive ICS panel can then be deployed on these samples to provide deeper knowledge about the polyfunctionality and phenotype of responding cells.
Misconceptions about ELISpot and ICS often lead to missed opportunities in choosing the most effective assay for your clinical trial. Below we address some of the most common misconceptions to help you make informed decisions.
Although the ELISpot assay requires fewer cells per well relative to the ICS assay, it is often ran in triplicate analysis for each condition tested, whereas ICS is usually ran as a single replicate. Therefore, the total number of cells required for both assays will be similar.
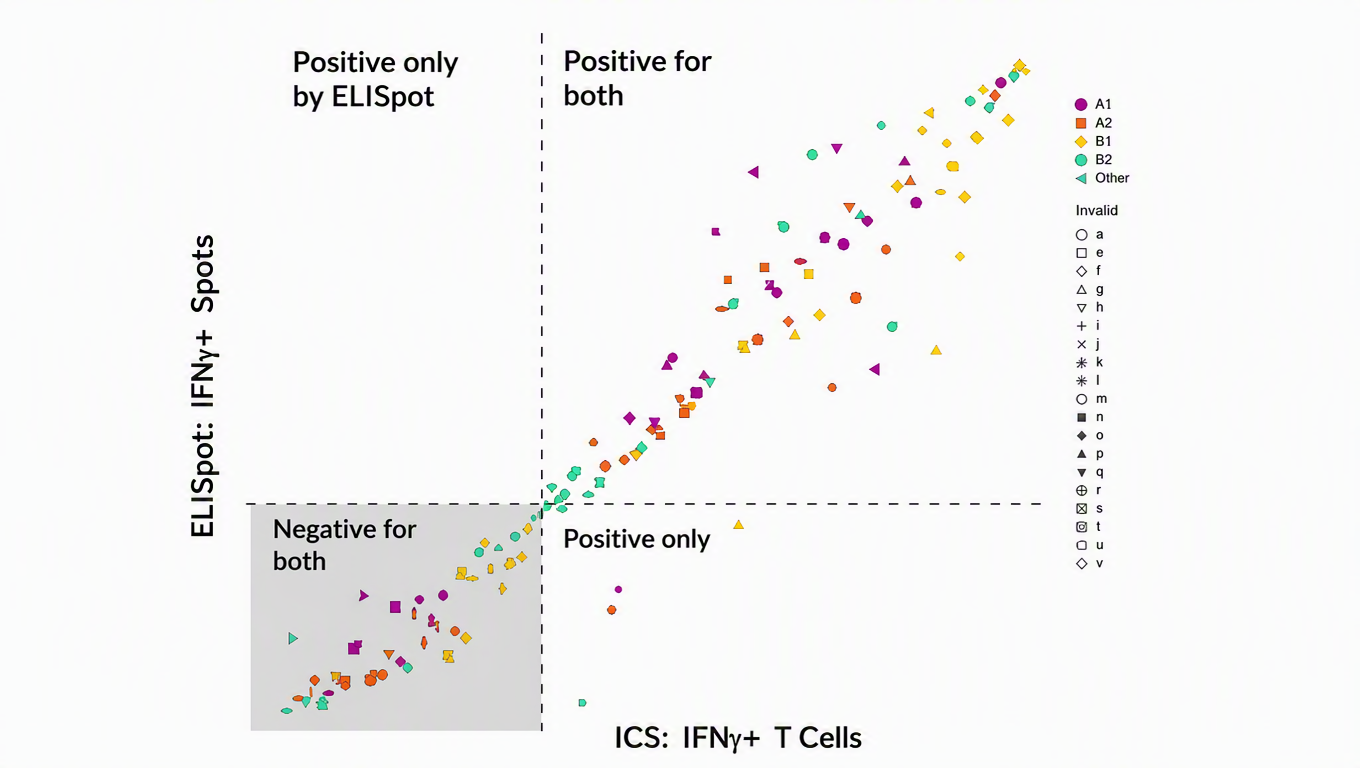
A development test measuring IFN-γ spot count for ELISpot and IFN-γ T cell response (CD3+) for ICS (as shown in Figure 1) clearly shows that both assays identified the same negative and positive responders, demonstrating similar sensitivity levels. Positive responders were not identified by ELISpot only.
Figure 1: Colors indicate different simulation conditions, and shapes represent donor response. Both assays identified the same negative and positive responders.
Although often considered the method of choice, ELISpot can face issues with high background levels affecting reproducibility and sensitivity. This challenge is not present with ICS since debris/dead cells are gated out through the use of cellular viability markers and scatter profiles.
ELISpot and ICS each play distinct roles in assessing cellular immune responses, with each assay suited to different applications. ICS’s multiplexing and phenotypic information allows it to provide detailed immune profiling, while ELISpot’s targeted approach make it ideal for measuring specific immune markers. The key is knowing when to use each assay based on your clinical goals.
By measuring immune cell responses through cytokine production, ELISpot and ICS serve as valuable functional assays. When paired with complementary technologies like Olink and MSD for comprehensive protein analysis in serum or plasma, they offer a robust framework to understand immune responses in clinical trials.
At CellCarta, we provide expertise and tools to help you navigate this decision and deliver reliable results. Our team has the experience and facilities to deliver high-quality ELISpot and ICS services, from technically challenging PBMC isolation to the use of advanced data analysis tools like CellEngine®, which provides fast analysis, collaborative features, and advanced visualization capabilities. We simplify the complexity of ELISpot and ICS from start to finish.
Unlock deeper insights into your clinical trials with our expert ICS services. Partner with us today to elevate your immune monitoring strategy.
Meet our experts

Céline Vandamme is a Scientific Business Director at CellCarta, specializing in the flow cytometry platform. With a PhD in immunology, and a broad expertise gained through her work at various academic and pharmaceutical institutions, Céline has profuse experience in designing flow cytometry assays to support immune monitoring activities in clinical trials.

Damien Montamat-Sicotte is a Scientific Business Director at CellCarta, specializing in the flow Cytometry platform. With a PhD in immunology and post-doctoral expertise from various institutions, Damien has profuse experience in managing the processing and analysis of clinical samples by flow cytometry in an immune monitoring context.
November 19, 2024
In clinical development, understanding how the immune response evolves upon administration of a therapeutics is often vital to assess safety and/or efficacy. While researchers have traditionally focussed primarily on humoral immunity through assessment of antibody production, the evaluation of cellular immunity has become increasingly important, driven by the need to understand both arms of the adaptive immune system. ELISpot and intracellular cytokine staining (ICS) are key functional assays used to measure the T cell immune responses in clinical trials. Understanding these techniques and selecting the most appropriate one for your application helps you generate the reliable immune response data you need for clinical development and approval.
While both assays are similar in terms of stimulation protocol (e.g: pools of overlapping peptides to stimulate T cells), they each measure immune responses in a distinct way:
Both ICS and ELISpot require cryopreserved peripheral blood mononuclear cells (PBMCs) as a starting point. High-quality PBMC isolation is therefore critical for maintaining cell viability and ensuring reliable results in both assays. Table 1 below shows a side-by-side comparison of other key similarities and differences between each method to guide your assay selection.
Table 1: Comparison of ICS and ELISpot assays.
| Technique | ICS | ELISpot |
|---|---|---|
| Analyte | Intracellular | Secreted/Membrane spot |
| Matrix | PBMC | PBMC |
| Cell # per well | 1-2 x 10^6 | 0.1-0.5 x 10^6 |
| Clinical endpoint and clinical phase | • Exploratory, secondary, primary • All clinical phases |
• Exploratory, secondary, primary • All clinical phases |
| Complexity level | ||
| Assay development/validation | High | High |
| Pre-analytical variables | Mid | High |
| Assay background | Mid | High |
| Data analysis | High | Low |
| Measurements | • Multiple cytokines • Cellular phenotype |
• Individual cytokine in separate assay |
| Multiplexing capability | High level: 16 color panel (conventional cytometry), 30+ color panel (spectral/CyTOF) | Singleplex (possible to multiplex with Fluorospot) |
| Sensitivity | Similar | Similar |
One of the key factors to consider when choosing between ELISpot and ICS is the level of detail required for immune response monitoring. Both assays offer unique advantages for different research goals.
ELISpot is ideal for measuring one or two cytokines at the single cell level. While it cannot identify which specific immune cells are producing the cytokines, ELISpot’s high sensitivity and simplicity of readout make it well suited for trials focused on specific immune markers. The sensitivity is, however, highly dependent on the quality of PBMCs.
ICS is best suited to research aiming to understand the phenotype of cytokine-producing cells and explore complex immune responses such as polyfunctionality. With its ability to multiplex—measuring several cytokines simultaneously—and provide detailed information about the cell types involved, ICS is particularly valuable in trials where you suspect the immune response may vary depending on the circumstances (e.g. switch of responding memory population during treatment or heterogenous disease etiology).
ELISpot and ICS assays can be combined in a two-step strategy to deeply characterize immune responses in a selection of clinical trial samples. In this perspective, the ELISpot assay can first be used as a screening tool to assess uncharacterized samples and define the ones (subjects/timepoints) that warrant further investigation to support clinical development. A comprehensive ICS panel can then be deployed on these samples to provide deeper knowledge about the polyfunctionality and phenotype of responding cells.
Misconceptions about ELISpot and ICS often lead to missed opportunities in choosing the most effective assay for your clinical trial. Below we address some of the most common misconceptions to help you make informed decisions.
Although the ELISpot assay requires fewer cells per well relative to the ICS assay, it is often ran in triplicate analysis for each condition tested, whereas ICS is usually ran as a single replicate. Therefore, the total number of cells required for both assays will be similar.
A development test measuring IFN-γ spot count for ELISpot and IFN-γ T cell response (CD3+) for ICS (as shown in Figure 1) clearly shows that both assays identified the same negative and positive responders, demonstrating similar sensitivity levels. Positive responders were not identified by ELISpot only.
Figure 1: Colors indicate different simulation conditions, and shapes represent donor response. Both assays identified the same negative and positive responders.
Although often considered the method of choice, ELISpot can face issues with high background levels affecting reproducibility and sensitivity. This challenge is not present with ICS since debris/dead cells are gated out through the use of cellular viability markers and scatter profiles.
ELISpot and ICS each play distinct roles in assessing cellular immune responses, with each assay suited to different applications. ICS’s multiplexing and phenotypic information allows it to provide detailed immune profiling, while ELISpot’s targeted approach make it ideal for measuring specific immune markers. The key is knowing when to use each assay based on your clinical goals.
By measuring immune cell responses through cytokine production, ELISpot and ICS serve as valuable functional assays. When paired with complementary technologies like Olink and MSD for comprehensive protein analysis in serum or plasma, they offer a robust framework to understand immune responses in clinical trials.
At CellCarta, we provide expertise and tools to help you navigate this decision and deliver reliable results. Our team has the experience and facilities to deliver high-quality ELISpot and ICS services, from technically challenging PBMC isolation to the use of advanced data analysis tools like CellEngine®, which provides fast analysis, collaborative features, and advanced visualization capabilities. We simplify the complexity of ELISpot and ICS from start to finish.
Unlock deeper insights into your clinical trials with our expert ICS services. Partner with us today to elevate your immune monitoring strategy.
Meet our experts
Céline Vandamme is a Scientific Business Director at CellCarta, specializing in the flow cytometry platform. With a PhD in immunology, and a broad expertise gained through her work at various academic and pharmaceutical institutions, Céline has profuse experience in designing flow cytometry assays to support immune monitoring activities in clinical trials.
Damien Montamat-Sicotte is a Scientific Business Director at CellCarta, specializing in the flow Cytometry platform. With a PhD in immunology and post-doctoral expertise from various institutions, Damien has profuse experience in managing the processing and analysis of clinical samples by flow cytometry in an immune monitoring context.
It’s easy to analyze cytometry data with CellCarta. Discover the software our experts use to get the job done right.
Our team of experts harness the potential of multiparametric flow cytometry. We work with you to deliver both qualitative and quantitative analyses of samples using a wide range of high throughput and multiplexing instruments – including spectral flow!
With CAP accredited and CLIA-certified laboratories, we ensure we provide rigorous quality assurance oversight.
Our flow cytometry platforms are in North America, Europe, China, and Australia, which allows us to support flow cytometry assays for global trials. All sites are equipped with the latest technology in the field.
Identify, quantify, and monitor your cell population of interest as well as its functional activity using off-the-shelf or highly customized panels. Our scientists are experts in both flow cytometry and immunology. They can guide you towards the right panels, so you get the most insight out of your samples.
CellEngine®: A New Generation of Cytometry Software
Our immunologists collaborated with our bioinformatics team to design CellEngine® – a cytometry software adapted to your needs:
Learn more about the power of CellEngine and its automation tools in a recent article by our expert!
It’s easy to analyze cytometry data with CellCarta. Discover the software our experts use to get the job done right.
Our team of experts harness the potential of multiparametric flow cytometry. We work with you to deliver both qualitative and quantitative analyses of samples using a wide range of high throughput and multiplexing instruments – including spectral flow!
With CAP accredited and CLIA-certified laboratories, we ensure we provide rigorous quality assurance oversight.
Our flow cytometry platforms are in North America, Europe, China, and Australia, which allows us to support flow cytometry assays for global trials. All sites are equipped with the latest technology in the field.
Identify, quantify, and monitor your cell population of interest as well as its functional activity using off-the-shelf or highly customized panels. Our scientists are experts in both flow cytometry and immunology. They can guide you towards the right panels, so you get the most insight out of your samples.
CellEngine®: A New Generation of Cytometry Software
Our immunologists collaborated with our bioinformatics team to design CellEngine® – a cytometry software adapted to your needs:
Learn more about the power of CellEngine and its automation tools in a recent article by our expert!