CAR Kinetics in Autoimmune Studies: Expert Insights on Designing Effective Monitoring Strategies | CellCarta

June 30, 2026

CAR-based therapies, originally developed for oncology, are now advancing into autoimmune diseases with promising early clinical results.1 In this setting, the biological context differs, and so does the way CAR kinetics are evaluated and understood.

To explore what this means in practice, we sat down with Laïla-Aïcha Hanafi, Director Global Assay Development here at CellCarta. With a background in immuno-oncology and translational biomarkers for cell therapies, Laïla works closely with sponsors to design and execute CAR kinetic strategies across programs.

In this Q&A, she shares how immunologists approach CAR kinetic monitoring in autoimmune disease and what sponsors should consider when designing their strategy.

How does CAR kinetic monitoring in autoimmune diseases differ from oncology?

It may sound obvious, but the differences in monitoring strategies really come down to the differing goals of CAR therapies in oncology versus autoimmune diseases. In oncology, the aim is to achieve strong CAR expansion and maintain those cells over time to sustain tumor control. Whereas in autoimmune disease, the focus is on eliminating diseased B cells, allowing the immune system to reset, and then letting CAR levels decline. From a monitoring perspective, that difference translates into two key considerations.

First, the timeline. In oncology, monitoring can extend for six months to a year or more because persistence is part of the intended outcome. In autoimmune programs, the most informative window is often much earlier, typically around the first one to two weeks post-infusion, when CAR expansion peaks. After that, the focus shifts to confirming contraction and monitoring immune cell recovery rather than tracking long-term maintenance.

Second, assay sensitivity. In autoimmune disease, starting doses are lower; as a result, CAR expansion may be harder to detect than in oncology. Detecting and quantifying those lower levels reliably requires highly sensitive, well-optimized assays.

What key factors should be considered when choosing an assay for CAR kinetic monitoring in autoimmune diseases?

Assay selection in autoimmune CAR programs largely comes down to sensitivity, specificity, and what type of information you need to generate.

In practice, two main assay families are used to monitor CAR kinetics: flow cytometry and PCR-based approaches. Digital PCR can provide highly sensitive, quantitative detection of the CAR construct and can be run in batches. It gives a clear numerical readout of CAR signal in the sample, but it does not indicate which cells are expressing the CAR.

Flow cytometry, on the other hand, allows direct detection of CAR-expressing cells and makes it possible to identify which cell types have been transfected. This is important in certain contexts, such as in vivo CAR approaches, where the CAR construct may not be restricted to a single predefined cell population. Flow cytometry also enables phenotyping alongside enumeration, providing additional biological insight.

In autoimmune programs, that biological context is particularly relevant, as sponsors need to understand how CAR levels relate to downstream immune effects, especially B-cell depletion and recovery.

In most cases, it’s best to use both approaches. PCR offers sensitivity and quantitative measurement of the construct, while flow cytometry provides cell-level resolution and biological context.

How should immunologists use CAR enumeration and absolute counts to interpret CAR kinetics in autoimmune disease?

Enumeration is the starting point for understanding CAR kinetics—it shows whether CAR cells are present and how their levels change over time. But interpreting those numbers meaningfully requires looking at absolute counts rather than percentages alone.

Absolute counts allow teams to construct the full kinetic curve: how quickly the CAR cells expand, how high they peak, and how long they remain detectable. That information helps in understanding dose, exposure, and how the CAR levels relate to B-cell reduction.

The early expansion phase, typically around day 7–14 post-infusion, is where absolute counts really add value, allowing the assessment of peak levels and overall exposure. Later in the timeline, when CAR levels are much lower, small numerical differences become less meaningful. At that stage, interpretation focuses more on whether CAR cells are still detectable rather than on detailed quantitative comparisons.

What are the biggest interpretation challenges in autoimmune CAR monitoring?

As mentioned, one of the main challenges is sensitivity. Because CAR expansion may be lower in autoimmune programs, detecting small populations reliably can be difficult. Increasing assay input or optimizing the assay design may be necessary to capture low-level signals.

Specificity is just as important, particularly when using flow cytometry. Background signal or non-specific binding can obscure low-level CAR detection. Addressing this may require increasing assay input to improve sensitivity, refining gating strategies, or adding additional markers, such as negative selection or “dump” channels, to reduce background.

Finally, as CAR levels decline, deeper phenotyping becomes more difficult. To ensure detailed biological insight can be extracted, it is better to conduct subpopulation analysis during the expansion peak, when there are sufficient events to analyze.

Overall, what would you say are the key things sponsors should keep in mind when designing CAR kinetic monitoring strategies for autoimmune programs?

In autoimmune programs, timing and sensitivity are key. Plan monitoring around the most informative window (days 7–14 post-infusion), make sure assays are sensitive enough for lower signals, and think beyond simple detection.

At the same time, it’s important not to look at CAR levels in isolation. In autoimmune disease, what ultimately matters is how those kinetics translate into biological effect. Monitoring B-cell depletion and recovery, including changes in specific subsets, helps connect CAR exposure to immune reset.

In the end, good CAR kinetic monitoring in autoimmune programs is about seeing the full picture, not just whether CAR cells are present, but how the kinetic profile aligns with downstream immune changes and the therapeutic goal.

Supporting CAR Kinetic Monitoring in Autoimmune Programs

To support robust CAR kinetic monitoring from early expansion through immune reconstitution, CellCarta provides integrated assay solutions tailored to autoimmune programs.

  • Digital PCR: custom and off-the-shelf assays for sensitive, quantitative detection of CAR constructs.
  • Flow cytometry: custom CAR detection panels for enumeration and phenotyping, and spectral flow cytometry for deeper immune profiling.
  • Advanced immune profiling: CyTOF for high-dimensional phenotyping and single-cell genomics for deeper biological characterization.
  • Ready-to-deploy assays for pharmacodynamic monitoring, including: B-cell aplasia and recovery, memory B-cell phenotyping, TBNK CD20 panels, and absolute B-cell enumeration.

Explore how CellCarta’s immunology platforms can help you generate high-quality CAR kinetic and immune monitoring data for your autoimmune programs


About the author:

author photo

Laïla-Aïcha Hanafi is the Director of Global Assay Development at CellCarta. She supplemented her PhD in immuno-oncology with post-doctoral studies in translational biomarkers for cell therapies at the Fred Hutchinson Cancer Center. Laïla has combined scientific knowledge and operational efficiency to address biomarker needs in clinical trial and prioritizing high-quality data to move therapies to the next stage of clinical deployment. 


Reference

  1. https://pmc.ncbi.nlm.nih.gov/articles/PMC12488630/pdf/fimmu-16-1613622.pdf

CAR Kinetics in Autoimmune Studies: Expert Insights on Designing Effective Monitoring Strategies | CellCarta

June 30, 2026

CAR-based therapies, originally developed for oncology, are now advancing into autoimmune diseases with promising early clinical results.1 In this setting, the biological context differs, and so does the way CAR kinetics are evaluated and understood.

To explore what this means in practice, we sat down with Laïla-Aïcha Hanafi, Director Global Assay Development here at CellCarta. With a background in immuno-oncology and translational biomarkers for cell therapies, Laïla works closely with sponsors to design and execute CAR kinetic strategies across programs.

In this Q&A, she shares how immunologists approach CAR kinetic monitoring in autoimmune disease and what sponsors should consider when designing their strategy.

How does CAR kinetic monitoring in autoimmune diseases differ from oncology?

It may sound obvious, but the differences in monitoring strategies really come down to the differing goals of CAR therapies in oncology versus autoimmune diseases. In oncology, the aim is to achieve strong CAR expansion and maintain those cells over time to sustain tumor control. Whereas in autoimmune disease, the focus is on eliminating diseased B cells, allowing the immune system to reset, and then letting CAR levels decline. From a monitoring perspective, that difference translates into two key considerations.

First, the timeline. In oncology, monitoring can extend for six months to a year or more because persistence is part of the intended outcome. In autoimmune programs, the most informative window is often much earlier, typically around the first one to two weeks post-infusion, when CAR expansion peaks. After that, the focus shifts to confirming contraction and monitoring immune cell recovery rather than tracking long-term maintenance.

Second, assay sensitivity. In autoimmune disease, starting doses are lower; as a result, CAR expansion may be harder to detect than in oncology. Detecting and quantifying those lower levels reliably requires highly sensitive, well-optimized assays.

What key factors should be considered when choosing an assay for CAR kinetic monitoring in autoimmune diseases?

Assay selection in autoimmune CAR programs largely comes down to sensitivity, specificity, and what type of information you need to generate.

In practice, two main assay families are used to monitor CAR kinetics: flow cytometry and PCR-based approaches. Digital PCR can provide highly sensitive, quantitative detection of the CAR construct and can be run in batches. It gives a clear numerical readout of CAR signal in the sample, but it does not indicate which cells are expressing the CAR.

Flow cytometry, on the other hand, allows direct detection of CAR-expressing cells and makes it possible to identify which cell types have been transfected. This is important in certain contexts, such as in vivo CAR approaches, where the CAR construct may not be restricted to a single predefined cell population. Flow cytometry also enables phenotyping alongside enumeration, providing additional biological insight.

In autoimmune programs, that biological context is particularly relevant, as sponsors need to understand how CAR levels relate to downstream immune effects, especially B-cell depletion and recovery.

In most cases, it’s best to use both approaches. PCR offers sensitivity and quantitative measurement of the construct, while flow cytometry provides cell-level resolution and biological context.

How should immunologists use CAR enumeration and absolute counts to interpret CAR kinetics in autoimmune disease?

Enumeration is the starting point for understanding CAR kinetics—it shows whether CAR cells are present and how their levels change over time. But interpreting those numbers meaningfully requires looking at absolute counts rather than percentages alone.

Absolute counts allow teams to construct the full kinetic curve: how quickly the CAR cells expand, how high they peak, and how long they remain detectable. That information helps in understanding dose, exposure, and how the CAR levels relate to B-cell reduction.

The early expansion phase, typically around day 7–14 post-infusion, is where absolute counts really add value, allowing the assessment of peak levels and overall exposure. Later in the timeline, when CAR levels are much lower, small numerical differences become less meaningful. At that stage, interpretation focuses more on whether CAR cells are still detectable rather than on detailed quantitative comparisons.

What are the biggest interpretation challenges in autoimmune CAR monitoring?

As mentioned, one of the main challenges is sensitivity. Because CAR expansion may be lower in autoimmune programs, detecting small populations reliably can be difficult. Increasing assay input or optimizing the assay design may be necessary to capture low-level signals.

Specificity is just as important, particularly when using flow cytometry. Background signal or non-specific binding can obscure low-level CAR detection. Addressing this may require increasing assay input to improve sensitivity, refining gating strategies, or adding additional markers, such as negative selection or “dump” channels, to reduce background.

Finally, as CAR levels decline, deeper phenotyping becomes more difficult. To ensure detailed biological insight can be extracted, it is better to conduct subpopulation analysis during the expansion peak, when there are sufficient events to analyze.

Overall, what would you say are the key things sponsors should keep in mind when designing CAR kinetic monitoring strategies for autoimmune programs?

In autoimmune programs, timing and sensitivity are key. Plan monitoring around the most informative window (days 7–14 post-infusion), make sure assays are sensitive enough for lower signals, and think beyond simple detection.

At the same time, it’s important not to look at CAR levels in isolation. In autoimmune disease, what ultimately matters is how those kinetics translate into biological effect. Monitoring B-cell depletion and recovery, including changes in specific subsets, helps connect CAR exposure to immune reset.

In the end, good CAR kinetic monitoring in autoimmune programs is about seeing the full picture, not just whether CAR cells are present, but how the kinetic profile aligns with downstream immune changes and the therapeutic goal.

Supporting CAR Kinetic Monitoring in Autoimmune Programs

To support robust CAR kinetic monitoring from early expansion through immune reconstitution, CellCarta provides integrated assay solutions tailored to autoimmune programs.

  • Digital PCR: custom and off-the-shelf assays for sensitive, quantitative detection of CAR constructs.
  • Flow cytometry: custom CAR detection panels for enumeration and phenotyping, and spectral flow cytometry for deeper immune profiling.
  • Advanced immune profiling: CyTOF for high-dimensional phenotyping and single-cell genomics for deeper biological characterization.
  • Ready-to-deploy assays for pharmacodynamic monitoring, including: B-cell aplasia and recovery, memory B-cell phenotyping, TBNK CD20 panels, and absolute B-cell enumeration.

Explore how CellCarta’s immunology platforms can help you generate high-quality CAR kinetic and immune monitoring data for your autoimmune programs


About the author:

author photo

Laïla-Aïcha Hanafi is the Director of Global Assay Development at CellCarta. She supplemented her PhD in immuno-oncology with post-doctoral studies in translational biomarkers for cell therapies at the Fred Hutchinson Cancer Center. Laïla has combined scientific knowledge and operational efficiency to address biomarker needs in clinical trial and prioritizing high-quality data to move therapies to the next stage of clinical deployment. 


Reference

  1. https://pmc.ncbi.nlm.nih.gov/articles/PMC12488630/pdf/fimmu-16-1613622.pdf

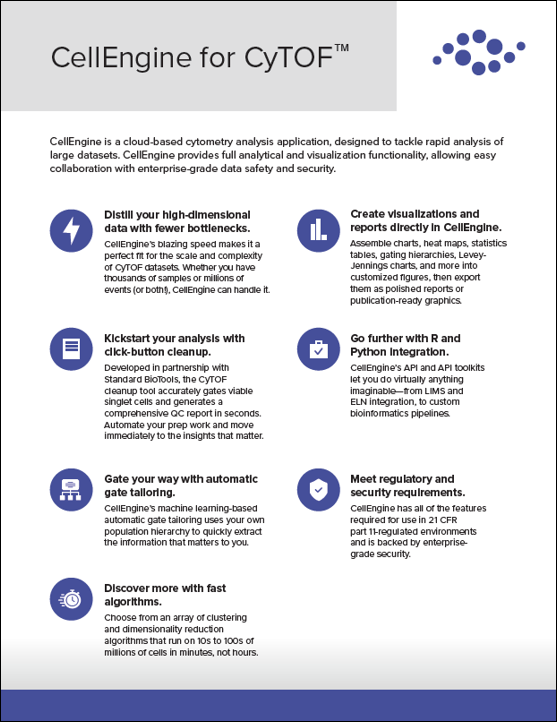
CellEngine for CyTOF | CellCarta

May 25, 2026

CellEngine for CyTOF™

CellEngine for CyTOF | CellCarta

May 25, 2026

CellEngine for CyTOF™

Biomarker strategies to support success at every stage of therapy development

April 3, 2025

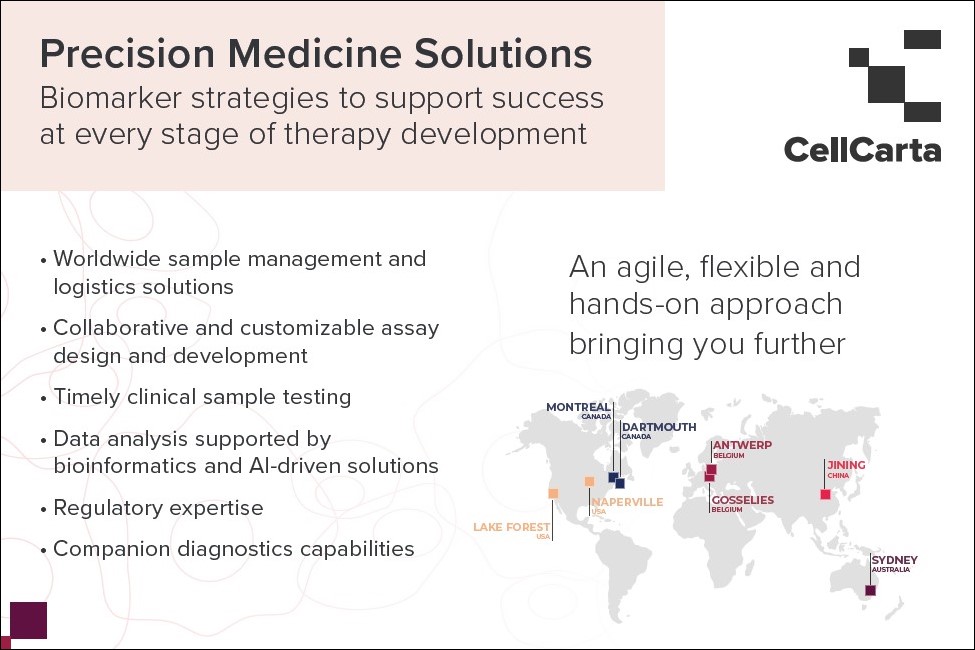
Precision Medicine Solutions: Biomarker strategies to support success at every stage of therapy development


Biomarker strategies to support success at every stage of therapy development

April 3, 2025

Precision Medicine Solutions: Biomarker strategies to support success at every stage of therapy development


Data Analysis Simplified | Book Your Demo with CellCarta

It’s easy to analyze cytometry data with CellCarta. Discover the software our experts use to get the job done right.

Watch the CellEngine Demo:

Our team of experts harness the potential of multiparametric flow cytometry. We work with you to deliver both qualitative and quantitative analyses of samples using a wide range of high throughput and multiplexing instruments including spectral flow!

With CAP accredited and CLIA-certified laboratories, we ensure we provide rigorous quality assurance oversight.

Our flow cytometry platforms are in North America, Europe, China, and Australia, which allows us to support flow cytometry assays for global trials. All sites are equipped with the latest technology in the field.

Identify, quantify, and monitor your cell population of interest as well as its functional activity using off-the-shelf or highly customized panels. Our scientists are experts in both flow cytometry and immunology. They can guide you towards the right panels, so you get the most insight out of your samples.

CellEngine®: A New Generation of Cytometry Software

Our immunologists collaborated with our bioinformatics team to design CellEngine® a cytometry software adapted to your needs:

Learn more about the power of CellEngine and its automation tools in a recent article by our expert!

Data Analysis Simplified | Book Your Demo with CellCarta

It’s easy to analyze cytometry data with CellCarta. Discover the software our experts use to get the job done right.

Watch the CellEngine Demo:

Our team of experts harness the potential of multiparametric flow cytometry. We work with you to deliver both qualitative and quantitative analyses of samples using a wide range of high throughput and multiplexing instruments including spectral flow!

With CAP accredited and CLIA-certified laboratories, we ensure we provide rigorous quality assurance oversight.

Our flow cytometry platforms are in North America, Europe, China, and Australia, which allows us to support flow cytometry assays for global trials. All sites are equipped with the latest technology in the field.

Identify, quantify, and monitor your cell population of interest as well as its functional activity using off-the-shelf or highly customized panels. Our scientists are experts in both flow cytometry and immunology. They can guide you towards the right panels, so you get the most insight out of your samples.

CellEngine®: A New Generation of Cytometry Software

Our immunologists collaborated with our bioinformatics team to design CellEngine® a cytometry software adapted to your needs:

Learn more about the power of CellEngine and its automation tools in a recent article by our expert!

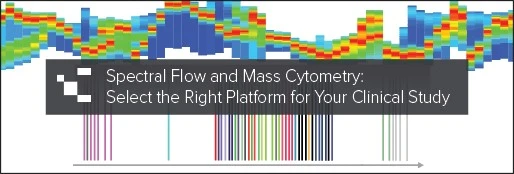
Spectral Flow and Mass Cytometry: Select the Right Platform

July 2, 2024

Spectral-Flow-and-Mass-Cytometry

Choosing the right cytometry platform is crucial for optimizing your clinical study. Both mass cytometry (CyTOF) and spectral flow cytometry are widely used technologies for clinical single-cell analysis.

These platforms provide the ability to build panels of a size that go beyond conventional flow cytometry, allowing a stronger multi-parametric approach to data generation. However, selecting the appropriate technology is key to unlocking the complexities of clinical development.

This blog post compares the two platforms to help you make an informed decision for your clinical immune monitoring.

Sample matrix considerations for both spectral flow and mass cytometry

Both mass and spectral flow cytometry platforms can handle various sample types, including peripheral blood mononuclear cells (PBMCs), fresh whole blood, gently fixed samples, or frozen specimens that have undergone an initial fixation step.

When analyzing fixed frozen samples, it is important to fix the specimen soon after drawing the blood; ideally within two hours. Due to the unstable nature of granulocytes, they tend to degranulate and clump up if the specimen is not fixed and frozen in a timely manner.

Another important consideration is the amount of time the specimen is exposed to fixative prior to freezing. Over fixing the cells can lead to deleterious epitope alteration and incomplete hemolysis upon thawing. Failure to take these points into consideration could compromise data quality.

For PBMCs or fresh whole blood, the performance of both technologies is comparable. For these matrices, quality of samples, careful clone selection and fluorophores or heavy metal combination are the crucial elements to consider.

The choice between mass and spectral flow cytometry may also depend on the availability of cells.

Mass cytometry typically requires a higher cell input for samples (2-3 fold higher), which becomes crucial when working with low-yield samples like tumour-infiltrating lymphocytes (TILs) or cells taken from biopsies, as approximately 15-25% of cells are lost during acquisition.

In scenarios with limited cell availability, spectral flow cytometry is the preferred option to maximise the number of events analysed and generate quality data.

Markers, colours, and panel complexity are central to your platform choice

Both mass and spectral flow cytometry platforms can handle large panels of around 40 markers, but the intended use of the data should be considered when deciding on the panel size and complexity and may not be advisable for clinical settings.

Although most people associate spectral flow cytometry with large panels, it should also be considered that spectral flow cytometers, such as CYTEK Aurora, can excel with smaller panels (12 to 20 colours), especially for tracking lowly expressed markers, thanks to its ability to reduce overlap between fluorophores and autofluorescence.

Large panel sizes are made possible in mass cytometry given the platform has very minimal channel crosstalk as it is detecting highly purified isotopes of various heavy metals rather than a broad fluorescent spectrum.

It is important to carefully consider the intended use of the assay when deciding the size of the panel. For panels measuring target expression, receptor occupancy or providing absolute counts (through a lyse/no wash protocol) to support clinical decisions, creating a focused flow cytometry panel with fewer than 12 markers can provide more reliable results.

In these cases, a conventional flow cytometry instrument with easy standardization and built-in audit trails, such as the Lyric can be the better option.

It should also be noted that when your desired readout is the mean fluorescence intensity (MFI), conventional flow cytometry offers a more stable measurement across different runs than spectral flow cytometry.

Throughput for spectral flow and mass cytometry: acquisition rates, stability, and flexibility

Mass cytometry has slower acquisition rates compared to flow cytometry but has exceptionally long post-stain stability due to the stable nature of the reagents and the absence of autofluorescence which tends to gradually increase over time.

Conventional and spectral flow cytometry offer a higher comparable throughput but have more limited post-staining stability, typically lasting under 24 hours, which can be a drawback in certain scenarios.

Reflecting on spectral flow and mass cytometry reagents

With flow cytometry comes a wide selection of reagents, including a variety of clones and fluorochrome assignments offering more flexibility for panel design. In addition, customization of fluorochrome binding can be performed both through commercial sources or in-house, which is beneficial when specific fluorochromes are not commercially available or when using custom reagents from sponsors.

Mass cytometry has less commercially available reagents due to the sourcing of reagents being offered by only one company. Because of this limitation, custom conjugation with desired heavy metals is necessary for most panels. As a results, having the ability to perform custom conjugation in-house is a must to allow flexible panel design.

Both cytometry platforms can effectively integrate sponsors’ reagents, such as CAR detection reagents, ensuring seamless panel integration and compatibility with chosen platforms.

Mass  cytometry or flow cytometry? It depends on your clinical objective

Both mass and spectral flow cytometry are valuable technologies for clinical immune monitoring. Selecting the most suitable platform requires a solid understanding of the relevant considerations as the choice of platform will most often come down to what markers are included in the panel of choice.

Our analytical team has unparalleled expertise in cytometry and leverages various techniques to yield the most informative results and quality data.

You can take a quick look at the table below.

Key points to consider Spectral Flow Cytometry Mass Cytometry (CyTOF)
Cell Input Requirements Lower cell input required, suitable for low-yield samples Requires higher cell input, 2-3 times more than spectral flow cytometry
Panel Size and Complexity Can handle large panels (40+ markers), but smaller panels (12-20 colors) can show better resolution of lowly expressed markers compared to conventional flow cytometry. Large panels possible (40+ markers), minimal channel crosstalk due to heavy metal detection
Throughput and Acquisition Higher acquisition throughput (comparable to conventional flow cytometry) but limited post-stain stability (<24 hours) Slower acquisition rates but high post-stain stability due to the more stable nature of heavy metals compared to fluorochromes
Reagent Availability and Customization Wide selection of fluorochrome-bound antibodies, allows for diverse marker choices and customization Limited commercially available reagents, often require custom conjugation and offers limited clone selection

Contact us to get your cytometry analysis project started!

About the author: 

author photo

Damien Montamat-Sicotte is a Scientific Business Director at CellCarta, specializing in the flow Cytometry platform. With a PhD in immunology and post-doctoral expertise from various institutions, Damien has profuse experience in managing the processing and analysis of clinical samples by flow cytometry in an immune monitoring context.

Spectral Flow and Mass Cytometry: Select the Right Platform

July 2, 2024

Spectral-Flow-and-Mass-Cytometry

Choosing the right cytometry platform is crucial for optimizing your clinical study. Both mass cytometry (CyTOF) and spectral flow cytometry are widely used technologies for clinical single-cell analysis.

These platforms provide the ability to build panels of a size that go beyond conventional flow cytometry, allowing a stronger multi-parametric approach to data generation. However, selecting the appropriate technology is key to unlocking the complexities of clinical development.

This blog post compares the two platforms to help you make an informed decision for your clinical immune monitoring.

Sample matrix considerations for both spectral flow and mass cytometry

Both mass and spectral flow cytometry platforms can handle various sample types, including peripheral blood mononuclear cells (PBMCs), fresh whole blood, gently fixed samples, or frozen specimens that have undergone an initial fixation step.

When analyzing fixed frozen samples, it is important to fix the specimen soon after drawing the blood; ideally within two hours. Due to the unstable nature of granulocytes, they tend to degranulate and clump up if the specimen is not fixed and frozen in a timely manner.

Another important consideration is the amount of time the specimen is exposed to fixative prior to freezing. Over fixing the cells can lead to deleterious epitope alteration and incomplete hemolysis upon thawing. Failure to take these points into consideration could compromise data quality.

For PBMCs or fresh whole blood, the performance of both technologies is comparable. For these matrices, quality of samples, careful clone selection and fluorophores or heavy metal combination are the crucial elements to consider.

The choice between mass and spectral flow cytometry may also depend on the availability of cells.

Mass cytometry typically requires a higher cell input for samples (2-3 fold higher), which becomes crucial when working with low-yield samples like tumour-infiltrating lymphocytes (TILs) or cells taken from biopsies, as approximately 15-25% of cells are lost during acquisition.

In scenarios with limited cell availability, spectral flow cytometry is the preferred option to maximise the number of events analysed and generate quality data.

Markers, colours, and panel complexity are central to your platform choice

Both mass and spectral flow cytometry platforms can handle large panels of around 40 markers, but the intended use of the data should be considered when deciding on the panel size and complexity and may not be advisable for clinical settings.

Although most people associate spectral flow cytometry with large panels, it should also be considered that spectral flow cytometers, such as CYTEK Aurora, can excel with smaller panels (12 to 20 colours), especially for tracking lowly expressed markers, thanks to its ability to reduce overlap between fluorophores and autofluorescence.

Large panel sizes are made possible in mass cytometry given the platform has very minimal channel crosstalk as it is detecting highly purified isotopes of various heavy metals rather than a broad fluorescent spectrum.

It is important to carefully consider the intended use of the assay when deciding the size of the panel. For panels measuring target expression, receptor occupancy or providing absolute counts (through a lyse/no wash protocol) to support clinical decisions, creating a focused flow cytometry panel with fewer than 12 markers can provide more reliable results.

In these cases, a conventional flow cytometry instrument with easy standardization and built-in audit trails, such as the Lyric can be the better option.

It should also be noted that when your desired readout is the mean fluorescence intensity (MFI), conventional flow cytometry offers a more stable measurement across different runs than spectral flow cytometry.

Throughput for spectral flow and mass cytometry: acquisition rates, stability, and flexibility

Mass cytometry has slower acquisition rates compared to flow cytometry but has exceptionally long post-stain stability due to the stable nature of the reagents and the absence of autofluorescence which tends to gradually increase over time.

Conventional and spectral flow cytometry offer a higher comparable throughput but have more limited post-staining stability, typically lasting under 24 hours, which can be a drawback in certain scenarios.

Reflecting on spectral flow and mass cytometry reagents

With flow cytometry comes a wide selection of reagents, including a variety of clones and fluorochrome assignments offering more flexibility for panel design. In addition, customization of fluorochrome binding can be performed both through commercial sources or in-house, which is beneficial when specific fluorochromes are not commercially available or when using custom reagents from sponsors.

Mass cytometry has less commercially available reagents due to the sourcing of reagents being offered by only one company. Because of this limitation, custom conjugation with desired heavy metals is necessary for most panels. As a results, having the ability to perform custom conjugation in-house is a must to allow flexible panel design.

Both cytometry platforms can effectively integrate sponsors’ reagents, such as CAR detection reagents, ensuring seamless panel integration and compatibility with chosen platforms.

Mass  cytometry or flow cytometry? It depends on your clinical objective

Both mass and spectral flow cytometry are valuable technologies for clinical immune monitoring. Selecting the most suitable platform requires a solid understanding of the relevant considerations as the choice of platform will most often come down to what markers are included in the panel of choice.

Our analytical team has unparalleled expertise in cytometry and leverages various techniques to yield the most informative results and quality data.

You can take a quick look at the table below.

Key points to consider Spectral Flow Cytometry Mass Cytometry (CyTOF)
Cell Input Requirements Lower cell input required, suitable for low-yield samples Requires higher cell input, 2-3 times more than spectral flow cytometry
Panel Size and Complexity Can handle large panels (40+ markers), but smaller panels (12-20 colors) can show better resolution of lowly expressed markers compared to conventional flow cytometry. Large panels possible (40+ markers), minimal channel crosstalk due to heavy metal detection
Throughput and Acquisition Higher acquisition throughput (comparable to conventional flow cytometry) but limited post-stain stability (<24 hours) Slower acquisition rates but high post-stain stability due to the more stable nature of heavy metals compared to fluorochromes
Reagent Availability and Customization Wide selection of fluorochrome-bound antibodies, allows for diverse marker choices and customization Limited commercially available reagents, often require custom conjugation and offers limited clone selection

Contact us to get your cytometry analysis project started!

About the author: 

author photo

Damien Montamat-Sicotte is a Scientific Business Director at CellCarta, specializing in the flow Cytometry platform. With a PhD in immunology and post-doctoral expertise from various institutions, Damien has profuse experience in managing the processing and analysis of clinical samples by flow cytometry in an immune monitoring context.