T-cell Engagers (TCEs): Data-Driven Development Insights

May 27, 2025

TCEs: Expanding the scope of precision immunotherapies  

T-cell engagers (TCEs) are typically bispecific antibodies that bind to both a disease-associated antigen and the CD3 protein on T cells, physically linking T cells to pathogenic cells and activating cytotoxic responses irrespectively of the patient’s HLA status.

Unlike personalized cell therapies, TCEs are off-the-shelf biologics that can be manufactured at scale, rapidly deployed, and administered in standard clinical settings without lymphodepletion. Combined with their ability to engage native T cells without genetic modification, TCEs also carry a favorable safety profile, with lower rates and severity of cytokine release syndrome (CRS), and lower risk of long-term T-cell malignancy as compared to cell-based therapies.

Since the first approval of TCE therapy in 2014, the number of TCEs entering the market has steeply increased over the past 3 years (Figure 1), and their use is expanding into new clinical areas, including autoimmune diseases, solid tumors, and infectious diseases, with both novel and repurposed targets.
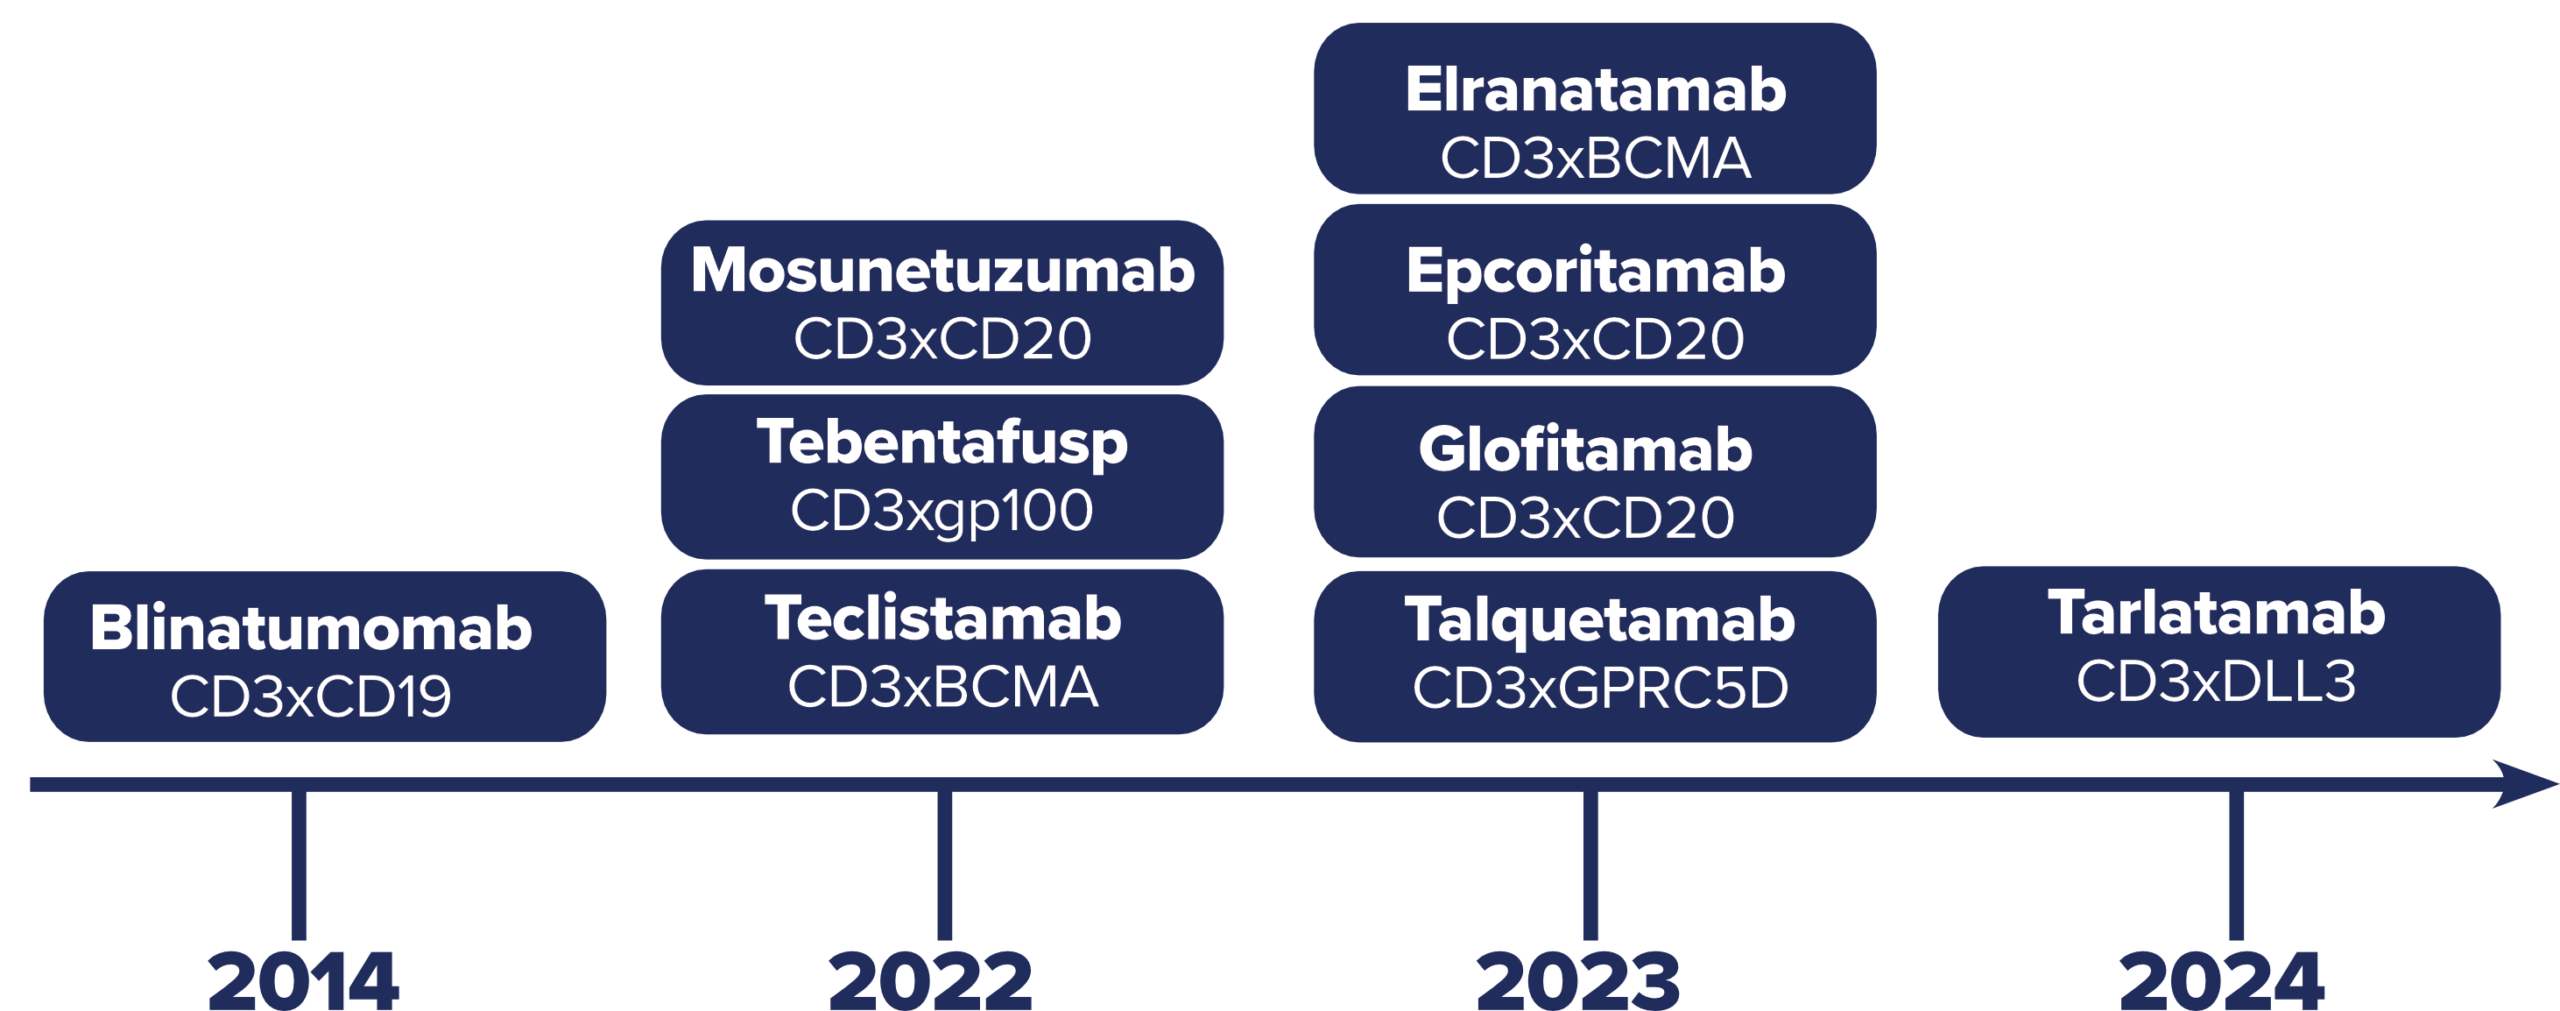
 

Figure 1: Timeline of TCE FDA approvals

As TCEs expand into new indications and patient populations, they offer a valuable opportunity for developers. But to successfully bring a TCE through clinical development and into regulatory approval, developers must generate a detailed understanding of the complex dynamics that shape TCE patient responses.

Generating the data you need to advance TCE development

Successful TCE development requires a clear understanding of specific aspects of therapeutic behavior, through detailed, targeted analysis. Selecting the appropriate parameters to measure is essential to generate meaningful insights that can guide clinical decision-making and development strategy.

1- Confirming target expression

Confirmation of target expression is essential to determine the potential of drug engagement—a prerequisite for efficacy. Developing precise target expression data is also critical for patient selection and stratification, companion diagnostic development, and evaluating off-target effects.

To generate this data, developers may assess expression in solid tumors using immunohistochemistry or immunofluorescence, or in peripheral or biopsy samples using flow cytometry. These approaches provide reliable data on whether the intended antigen is sufficiently present.

2- Assessing long-term efficacy

The success of TCEs depends on creating sustained immune activity. Demonstrating the long-term efficacy and curative potential of TCEs requires extended follow-ups—particularly for newer indications such as solid tumors or autoimmune diseases.

To get these insights, developers must monitor pathogenic cell populations over time, using flow cytometry for liquid samples or immunohistochemistry or immunofluorescence for tissue, and correlate these findings with longitudinal clinical data.

3- Understanding the mechanisms of primary resistance

Not all patients respond to TCE therapy, and understanding pre-existing T-cell landscapes is critical to predicting which patients will benefit most from treatment. Developers must establish baseline composition of the T-cell compartment early in development to identify immune signatures that predict response or resistance.

To do so, developers can apply high-dimensional spectral flow cytometry phenotyping panels to characterize surface markers and immune subsets in detail. Additionally, single-cell resolution assays that combine transcriptomic, proteomic, and T cell repertoire data can provide a more integrated view of T-cell status to help predict clinical response.

4- Tracking acquired resistance

Even in patients who respond to TCE treatment initially, T cells may lose function over time due to sustained activation, imposing major constraints on the drug’s therapeutic efficacy. Detecting this shift in response throughout treatment requires the assessment of T-cell activation and exhaustion markers.

This can be achieved using standardized flow cytometry panels with widely used markers for exhaustion (e.g., PD-1, TIM-3, LAG3, CD39), and activation (e.g., CD69, CD38, HLA-DR). In parallel, enumeration panels can be used to track pathogenic cell counts and help correlate changes in T-cell state with therapeutic efficacy—providing the data needed to inform treatment adjustments.

5- Assessing safety risks

While TCEs generally offer a favorable safety profile compared to cell-based therapies, there are still risks of adverse effects, like CRS and immune effector cell-associated neurotoxicity syndrome (ICANS), that must be assessed.

To support this, developers can deploy cytokine profiling during early clinical phases to capture broad inflammatory responses. Several immunoassay platforms, including Olink®, MSD®, and ELLA™, can be used to enable sensitive, multiplexed measurement of cytokine levels and understand the risk of adverse effects.

Building a strong foundation for successful TCE development

TCEs offer clear advantages as a scalable and versatile immunotherapy platform, but their successful development depends on a deep understanding of how these therapies perform. Monitoring key parameters such as target expression, immune activation, and resistance over time is essential to generate the evidence required to advance confidently through development.

As TCEs expand into new indications, developers who can integrate these insights early will be best positioned to navigate complexity, reduce uncertainty, and make informed decisions that move their therapies forward.

CellCarta can support your TCE program with the capabilities and expertise needed to drive confident development. Get in touch with our experts to find out more.

About the author:

author photo

Céline Vandamme is a Scientific Business Director at CellCarta, specializing in the flow cytometry platform. With a PhD in immunology, and a broad expertise gained through her work at various academic and pharmaceutical institutions, Céline has profuse experience in designing flow cytometry assays to support immune monitoring activities in clinical trials.


T-cell Engagers (TCEs): Data-Driven Development Insights

May 27, 2025

TCEs: Expanding the scope of precision immunotherapies  

T-cell engagers (TCEs) are typically bispecific antibodies that bind to both a disease-associated antigen and the CD3 protein on T cells, physically linking T cells to pathogenic cells and activating cytotoxic responses irrespectively of the patient’s HLA status.

Unlike personalized cell therapies, TCEs are off-the-shelf biologics that can be manufactured at scale, rapidly deployed, and administered in standard clinical settings without lymphodepletion. Combined with their ability to engage native T cells without genetic modification, TCEs also carry a favorable safety profile, with lower rates and severity of cytokine release syndrome (CRS), and lower risk of long-term T-cell malignancy as compared to cell-based therapies.

Since the first approval of TCE therapy in 2014, the number of TCEs entering the market has steeply increased over the past 3 years (Figure 1), and their use is expanding into new clinical areas, including autoimmune diseases, solid tumors, and infectious diseases, with both novel and repurposed targets.


Figure 1: Timeline of TCE FDA approvals

As TCEs expand into new indications and patient populations, they offer a valuable opportunity for developers. But to successfully bring a TCE through clinical development and into regulatory approval, developers must generate a detailed understanding of the complex dynamics that shape TCE patient responses.

Generating the data you need to advance TCE development

Successful TCE development requires a clear understanding of specific aspects of therapeutic behavior, through detailed, targeted analysis. Selecting the appropriate parameters to measure is essential to generate meaningful insights that can guide clinical decision-making and development strategy.

1- Confirming target expression

Confirmation of target expression is essential to determine the potential of drug engagement—a prerequisite for efficacy. Developing precise target expression data is also critical for patient selection and stratification, companion diagnostic development, and evaluating off-target effects.

To generate this data, developers may assess expression in solid tumors using immunohistochemistry or immunofluorescence, or in peripheral or biopsy samples using flow cytometry. These approaches provide reliable data on whether the intended antigen is sufficiently present.

2- Assessing long-term efficacy

The success of TCEs depends on creating sustained immune activity. Demonstrating the long-term efficacy and curative potential of TCEs requires extended follow-ups—particularly for newer indications such as solid tumors or autoimmune diseases.

To get these insights, developers must monitor pathogenic cell populations over time, using flow cytometry for liquid samples or immunohistochemistry or immunofluorescence for tissue, and correlate these findings with longitudinal clinical data.

3- Understanding the mechanisms of primary resistance

Not all patients respond to TCE therapy, and understanding pre-existing T-cell landscapes is critical to predicting which patients will benefit most from treatment. Developers must establish baseline composition of the T-cell compartment early in development to identify immune signatures that predict response or resistance.

To do so, developers can apply high-dimensional spectral flow cytometry phenotyping panels to characterize surface markers and immune subsets in detail. Additionally, single-cell resolution assays that combine transcriptomic, proteomic, and T cell repertoire data can provide a more integrated view of T-cell status to help predict clinical response.

4- Tracking acquired resistance

Even in patients who respond to TCE treatment initially, T cells may lose function over time due to sustained activation, imposing major constraints on the drug’s therapeutic efficacy. Detecting this shift in response throughout treatment requires the assessment of T-cell activation and exhaustion markers.

This can be achieved using standardized flow cytometry panels with widely used markers for exhaustion (e.g., PD-1, TIM-3, LAG3, CD39), and activation (e.g., CD69, CD38, HLA-DR). In parallel, enumeration panels can be used to track pathogenic cell counts and help correlate changes in T-cell state with therapeutic efficacy—providing the data needed to inform treatment adjustments.

5- Assessing safety risks

While TCEs generally offer a favorable safety profile compared to cell-based therapies, there are still risks of adverse effects, like CRS and immune effector cell-associated neurotoxicity syndrome (ICANS), that must be assessed.

To support this, developers can deploy cytokine profiling during early clinical phases to capture broad inflammatory responses. Several immunoassay platforms, including Olink®, MSD®, and ELLA™, can be used to enable sensitive, multiplexed measurement of cytokine levels and understand the risk of adverse effects.

Building a strong foundation for successful TCE development

TCEs offer clear advantages as a scalable and versatile immunotherapy platform, but their successful development depends on a deep understanding of how these therapies perform. Monitoring key parameters such as target expression, immune activation, and resistance over time is essential to generate the evidence required to advance confidently through development.

As TCEs expand into new indications, developers who can integrate these insights early will be best positioned to navigate complexity, reduce uncertainty, and make informed decisions that move their therapies forward.

CellCarta can support your TCE program with the capabilities and expertise needed to drive confident development. Get in touch with our experts to find out more.

About the author:

author photo

Céline Vandamme is a Scientific Business Director at CellCarta, specializing in the flow cytometry platform. With a PhD in immunology, and a broad expertise gained through her work at various academic and pharmaceutical institutions, Céline has profuse experience in designing flow cytometry assays to support immune monitoring activities in clinical trials.

Biomarkers & AI in Future ADCs: Dr. Powles’ Insights

March 17, 2025

Antibody-drug conjugates (ADCs) are changing cancer treatment for the better, combining precision-targeting of cancer cells with the potency of chemotherapy.  

Perhaps one of the most exciting recent advances in ADCs was seen in a trial led by renowned oncologist Dr Thomas Powles. The combination treatment of enfortumab vedotin (EV), a nectin-4 ADC, and pembrolizumab (pembro), a PD-1 inhibitor, more than doubled the median survival of metastatic bladder cancer patients, from one year with standard chemotherapy, to two and a half years.   

Thanks to these transformative results, EV-pembro has superseded traditional platinum-based chemotherapy as the first-line treatment, and Dr Powles believes a cure for bladder cancer is now possible—something that would have seemed unimaginable just a few years ago.  

In our latest Let’s Talk webcast, we had the privilege of talking to Dr Powles about the future possibilities of ADCs. While in our previous blog we discussed his thoughts on the future of ADCs in cancer treatment, here we summarize his insights on the pivotal role that biomarkers and AI could play in their development.  

The importance of biomarkers in future ADC development

As with many other new precision medicine therapeutic strategies, a key hurdle in ADC development is understanding why some patients benefit more than others. While EV-pembro is broadly effective in treating bladder cancer, since nectin-4 is expressed in 90% of the cancer cells, there are still some patients that show limited benefit, and understanding why has proven challenging. Identifying biomarkers to stratify subtle differences in patient profiles may be crucial to achieving better outcomes.  

“If we’re going to cure bladder cancer, we may not do so with EV-pembro alone,” said Dr Powles. “While it could serve as a baseline treatment for many, we must understand why some patients don’t respond as well, and how we can improve their response, if we are going to achieve a cure.”  

“That’s where the second generation of biomarkers come in“ he continues. “Using transcriptomics and multiplex analysis, we could see what’s expressed in non-responders and find out whether we should be using other agents or more complex immune therapy for those patients.” 

Dr Powles believes that biomarkers will be key to ADC breakthroughs beyond bladder cancer, too. “Deep down, I think the transformative result we’ve seen with EV-pembro in bladder cancer is not a black swan event,” he said. “I think it’s possible in subsets of other cancers.” 

While other ADCs have shown promise, such as those directed at TROP2 and HER2, patient selection criteria remain imprecise, confounding their real effectiveness.  

For TROP2 ADCs, such as sacituzumab govitecan, despite rapid progress, a more refined biomarker strategy is still needed to identify the patients who will benefit the most from this treatment. Similarly, with the HER2-low breast cancer ADC trastuzumab deruxtecan, there is debate around how HER2 expression levels correlate with response rates. HER2 scoring methods can produce inconsistent results, therefore more precise biomarker assessment could substantially improve treatment outcomes.

The role of AI in future ADC development

To help in advancing ADC development, researchers are looking to leverage AI technologies to improve biomarker assessment. Traditional pathology methods rely on human interpretation, which can lead to inconsistencies in how biomarkers are assessed across different labs and clinical settings.

“Diagnostic pathology using AI can bring a standardization that currently isn’t possible with traditional methods,” said Powles. “So far, we haven’t been overly successful with biomarker development. To move forwards, we need AI technology to reduce variability and improve accuracy in patient selection.”

Currently, researchers are investigating the use of AI in identifying responders and non-responders for TROP2 ADCs. When it comes to their use in lung cancer treatment, Dr Powles states: “If you can find the 30% of patients that have a strong response, that could potentially be transformative. If we’re not currently seeing any improvement over traditional chemotherapy with TROP2 ADCs, then we need to find a smarter way of assessing biomarkers, and that could be through AI.”

Looking ahead

The future of ADCs holds great promise, with refined biomarker assessment and AI potentially playing a pivotal role in the development of more personalized therapies in finely-stratified patient cohorts.  

In the full webcast, Dr Powles shares his thoughts on the current and future treatment landscape of ADCs, including where he believes there is most potential for another breakthrough ADC treatment, and the technologies and strategies that could drive their development.  

Don’t miss out on hearing the firsthand insights of a true ADC expert—watch the webcast on demand today: Webcast – Thomas Powles – Gated | CellCarta.

About the author:

author photo

Céline Vandamme is a Scientific Business Director at CellCarta, specializing in the flow cytometry platform. With a PhD in immunology, and a broad expertise gained through her work at various academic and pharmaceutical institutions, Céline has profuse experience in designing flow cytometry assays to support immune monitoring activities in clinical trials.
Biomarkers & AI in Future ADCs: Dr. Powles’ Insights

March 17, 2025

Antibody-drug conjugates (ADCs) are changing cancer treatment for the better, combining precision-targeting of cancer cells with the potency of chemotherapy.  

Perhaps one of the most exciting recent advances in ADCs was seen in a trial led by renowned oncologist Dr Thomas Powles. The combination treatment of enfortumab vedotin (EV), a nectin-4 ADC, and pembrolizumab (pembro), a PD-1 inhibitor, more than doubled the median survival of metastatic bladder cancer patients, from one year with standard chemotherapy, to two and a half years.   

Thanks to these transformative results, EV-pembro has superseded traditional platinum-based chemotherapy as the first-line treatment, and Dr Powles believes a cure for bladder cancer is now possible—something that would have seemed unimaginable just a few years ago.  

In our latest Let’s Talk webcast, we had the privilege of talking to Dr Powles about the future possibilities of ADCs. While in our previous blog we discussed his thoughts on the future of ADCs in cancer treatment, here we summarize his insights on the pivotal role that biomarkers and AI could play in their development.  

The importance of biomarkers in future ADC development

As with many other new precision medicine therapeutic strategies, a key hurdle in ADC development is understanding why some patients benefit more than others. While EV-pembro is broadly effective in treating bladder cancer, since nectin-4 is expressed in 90% of the cancer cells, there are still some patients that show limited benefit, and understanding why has proven challenging. Identifying biomarkers to stratify subtle differences in patient profiles may be crucial to achieving better outcomes.  

“If we’re going to cure bladder cancer, we may not do so with EV-pembro alone,” said Dr Powles. “While it could serve as a baseline treatment for many, we must understand why some patients don’t respond as well, and how we can improve their response, if we are going to achieve a cure.”  

“That’s where the second generation of biomarkers come in“ he continues. “Using transcriptomics and multiplex analysis, we could see what’s expressed in non-responders and find out whether we should be using other agents or more complex immune therapy for those patients.” 

Dr Powles believes that biomarkers will be key to ADC breakthroughs beyond bladder cancer, too. “Deep down, I think the transformative result we’ve seen with EV-pembro in bladder cancer is not a black swan event,” he said. “I think it’s possible in subsets of other cancers.” 

While other ADCs have shown promise, such as those directed at TROP2 and HER2, patient selection criteria remain imprecise, confounding their real effectiveness.  

For TROP2 ADCs, such as sacituzumab govitecan, despite rapid progress, a more refined biomarker strategy is still needed to identify the patients who will benefit the most from this treatment. Similarly, with the HER2-low breast cancer ADC trastuzumab deruxtecan, there is debate around how HER2 expression levels correlate with response rates. HER2 scoring methods can produce inconsistent results, therefore more precise biomarker assessment could substantially improve treatment outcomes.

The role of AI in future ADC development

To help in advancing ADC development, researchers are looking to leverage AI technologies to improve biomarker assessment. Traditional pathology methods rely on human interpretation, which can lead to inconsistencies in how biomarkers are assessed across different labs and clinical settings.

“Diagnostic pathology using AI can bring a standardization that currently isn’t possible with traditional methods,” said Powles. “So far, we haven’t been overly successful with biomarker development. To move forwards, we need AI technology to reduce variability and improve accuracy in patient selection.”

Currently, researchers are investigating the use of AI in identifying responders and non-responders for TROP2 ADCs. When it comes to their use in lung cancer treatment, Dr Powles states: “If you can find the 30% of patients that have a strong response, that could potentially be transformative. If we’re not currently seeing any improvement over traditional chemotherapy with TROP2 ADCs, then we need to find a smarter way of assessing biomarkers, and that could be through AI.”

Looking ahead

The future of ADCs holds great promise, with refined biomarker assessment and AI potentially playing a pivotal role in the development of more personalized therapies in finely-stratified patient cohorts.  

In the full webcast, Dr Powles shares his thoughts on the current and future treatment landscape of ADCs, including where he believes there is most potential for another breakthrough ADC treatment, and the technologies and strategies that could drive their development.  

Don’t miss out on hearing the firsthand insights of a true ADC expert—watch the webcast on demand today: Webcast – Thomas Powles – Gated | CellCarta.

About the author:

author photo

Céline Vandamme is a Scientific Business Director at CellCarta, specializing in the flow cytometry platform. With a PhD in immunology, and a broad expertise gained through her work at various academic and pharmaceutical institutions, Céline has profuse experience in designing flow cytometry assays to support immune monitoring activities in clinical trials.
How Antibody-Drug Conjugates (ADCs) Are Advancing Precision Cancer Treatment

February 18, 2025

Cancer treatment is undergoing a transformation, with antibody-drug conjugates (ADCs) at the forefront of this progress1. ADCs consist of a monoclonal antibody conjugated to a cytotoxic payload, offering precise targeting and a potent killing effect against cancer cells1. The potential of these targeted therapies was exemplified in the groundbreaking work of Dr Thomas Powles, Director of the Bart’s Cancer Center, in which an ADC combination treatment more than doubled the median survival of bladder cancer patients.

Dr Powles’ work has earned him a spot in Nature’s 10 and TIME’s 100 lists for most influential people in science and health in 2024. He recently joined Christopher Ung, our Chief Scientific Business Officer, on our Let’s Talk webcast to share his first-hand, in-depth insights into ADCs. Here, we break down his research success and share his thoughts on the current and future ADC treatment landscape.

Dr Powles’ bladder cancer breakthrough

Dr Powles describes bladder cancer as a ‘Cinderella cancer’ due to there being little treatment progress over the last 40 years. The traditional approach — platinum-based chemotherapy — offers patients only modest benefits, with a median survival of around one year and a progression-free survival (PFS) of just six months.

However, Dr Powles’ trial of enfortumab vedotin (EV), a nectin-4 ADC, in combination with PD-1 inhibitor pembrolizumab, redefined expectations. The treatment more than doubled the median survival of patients, from one year with standard chemotherapy to 2.5 years, and doubled the PFS.

“We had tried many times to beat platinum-based chemotherapy and always failed. This was the first time we succeeded, but we didn’t just succeed—it was transformative,” said Dr Powles. “I wouldn’t have said this two years ago, but I think we might cure bladder cancer.”

The results of the EV-pembro trial highlight the potential of ADCs to reshape the cancer treatment landscape.

Expanding horizons: the growing role of ADCs in cancer treatment

In bladder cancer, EV-pembro has already replaced the traditional platinum-based chemotherapy as the front-line treatment. Dr Powles views ADCs as a “second-generation, targeted chemotherapy” with the potential to replace traditional approaches in some cancers. In the webcast, he highlighted several areas where ADCs are already in use, and where they hold future promise:

  • Breast cancer: The ADC trastuzumab deruxtecan (TDXd) has been approved to treat HER2-low breast cancers, an area where treatment options were previously limited. Research continues in potentially redefining biomarker selection to improve patient outcomes.
  • Lung cancer: Lung cancer research is currently undergoing rapid developments, with several ongoing trials of ADCs targeting Trop-2 (such as sacituzumab govitecan).
  • Urothelial cancer: In addition to EV-pembro, HER3-EGFR ADCs are showing promise in urothelial cancer, with an overall response rate of 43.5% in a recent trial.2
  • Hematological malignancies: ADCs targeting cluster of differentiation (CD) markers are currently being explored for lymphomas and leukemia.

The future of ADC development

While current ADCs have already transformed cancer treatment in some areas, Dr Powles believes there is still significant room for improvement. With advances in technology and drug design, future ADCs could be more effective and have fewer side effects.

“Even the established ADCs have a long way to go” said Dr Powles “I want to see new payloads, I want to see improved linker molecule technology, and I want to see duality of targeting. I think some of the issues we see today, like off target toxicity, could be resolved with these advancements.” He continues: “I foresee that we’re going to see a second generation of ADCs, and it’s going to be really promising.”

AI and biomarker-driven approaches are set to be key drivers of ADC advancement. Biomarkers are already essential in selecting patients for ADC treatments, but future ADCs may require more precise patient stratification. AI-powered digital pathology tools could improve the accuracy of biomarker detection, refining patient selection to ensure that treatments reach those most likely to benefit.

With these developments on the horizon, ADCs are poised to play an even greater role in cancer treatment — potentially redefining the standard of care across multiple cancer types.

To hear more of Dr Powles first-hand insights into the future of ADCs, watch the full webcast on-demand now: Webcast – Thomas Powles – Gated | CellCarta


About the Author:

author photo

Céline Vandamme is a Scientific Business Director at CellCarta, specializing in the flow cytometry platform. With a PhD in immunology, and a broad expertise gained through her work at various academic and pharmaceutical institutions, Céline has profuse experience in designing flow cytometry assays to support immune monitoring activities in clinical trials.
References

  1. Colombo R, Tarantino P, Rich J, et al. The Journey of Antibody–Drug Conjugates: Lessons Learned from 40 Years of Development. Cancer Discovery. 2024; 14 (11): 2089–2108.
  2. Ye D, Bian X, Yang T, Jiang S, et al. BL-B01D1, an EGFR x HER3 bispecific antibody-drug conjugate (ADC), in patients with locally advanced or metastatic urothelial carcinoma (UC). Ann Oncol. 2024; 35(suppl_2): S1135-S1169.

How Antibody-Drug Conjugates (ADCs) Are Advancing Precision Cancer Treatment

February 18, 2025

Cancer treatment is undergoing a transformation, with antibody-drug conjugates (ADCs) at the forefront of this progress1. ADCs consist of a monoclonal antibody conjugated to a cytotoxic payload, offering precise targeting and a potent killing effect against cancer cells1. The potential of these targeted therapies was exemplified in the groundbreaking work of Dr Thomas Powles, Director of the Bart’s Cancer Center, in which an ADC combination treatment more than doubled the median survival of bladder cancer patients.

Dr Powles’ work has earned him a spot in Nature’s 10 and TIME’s 100 lists for most influential people in science and health in 2024. He recently joined Christopher Ung, our Chief Scientific Business Officer, on our Let’s Talk webcast to share his first-hand, in-depth insights into ADCs. Here, we break down his research success and share his thoughts on the current and future ADC treatment landscape.

Dr Powles’ bladder cancer breakthrough

Dr Powles describes bladder cancer as a ‘Cinderella cancer’ due to there being little treatment progress over the last 40 years. The traditional approach — platinum-based chemotherapy — offers patients only modest benefits, with a median survival of around one year and a progression-free survival (PFS) of just six months.

However, Dr Powles’ trial of enfortumab vedotin (EV), a nectin-4 ADC, in combination with PD-1 inhibitor pembrolizumab, redefined expectations. The treatment more than doubled the median survival of patients, from one year with standard chemotherapy to 2.5 years, and doubled the PFS.

“We had tried many times to beat platinum-based chemotherapy and always failed. This was the first time we succeeded, but we didn’t just succeed—it was transformative,” said Dr Powles. “I wouldn’t have said this two years ago, but I think we might cure bladder cancer.”

The results of the EV-pembro trial highlight the potential of ADCs to reshape the cancer treatment landscape.

Expanding horizons: the growing role of ADCs in cancer treatment

In bladder cancer, EV-pembro has already replaced the traditional platinum-based chemotherapy as the front-line treatment. Dr Powles views ADCs as a “second-generation, targeted chemotherapy” with the potential to replace traditional approaches in some cancers. In the webcast, he highlighted several areas where ADCs are already in use, and where they hold future promise:

  • Breast cancer: The ADC trastuzumab deruxtecan (TDXd) has been approved to treat HER2-low breast cancers, an area where treatment options were previously limited. Research continues in potentially redefining biomarker selection to improve patient outcomes.
  • Lung cancer: Lung cancer research is currently undergoing rapid developments, with several ongoing trials of ADCs targeting Trop-2 (such as sacituzumab govitecan).
  • Urothelial cancer: In addition to EV-pembro, HER3-EGFR ADCs are showing promise in urothelial cancer, with an overall response rate of 43.5% in a recent trial.2
  • Hematological malignancies: ADCs targeting cluster of differentiation (CD) markers are currently being explored for lymphomas and leukemia.

The future of ADC development

While current ADCs have already transformed cancer treatment in some areas, Dr Powles believes there is still significant room for improvement. With advances in technology and drug design, future ADCs could be more effective and have fewer side effects.

“Even the established ADCs have a long way to go” said Dr Powles “I want to see new payloads, I want to see improved linker molecule technology, and I want to see duality of targeting. I think some of the issues we see today, like off target toxicity, could be resolved with these advancements.” He continues: “I foresee that we’re going to see a second generation of ADCs, and it’s going to be really promising.”

AI and biomarker-driven approaches are set to be key drivers of ADC advancement. Biomarkers are already essential in selecting patients for ADC treatments, but future ADCs may require more precise patient stratification. AI-powered digital pathology tools could improve the accuracy of biomarker detection, refining patient selection to ensure that treatments reach those most likely to benefit.

With these developments on the horizon, ADCs are poised to play an even greater role in cancer treatment — potentially redefining the standard of care across multiple cancer types.

To hear more of Dr Powles first-hand insights into the future of ADCs, watch the full webcast on-demand now: Webcast – Thomas Powles – Gated | CellCarta


About the Author:

author photo

Céline Vandamme is a Scientific Business Director at CellCarta, specializing in the flow cytometry platform. With a PhD in immunology, and a broad expertise gained through her work at various academic and pharmaceutical institutions, Céline has profuse experience in designing flow cytometry assays to support immune monitoring activities in clinical trials.

References

  1. Colombo R, Tarantino P, Rich J, et al. The Journey of Antibody–Drug Conjugates: Lessons Learned from 40 Years of Development. Cancer Discovery. 2024; 14 (11): 2089–2108.
  2. Ye D, Bian X, Yang T, Jiang S, et al. BL-B01D1, an EGFR x HER3 bispecific antibody-drug conjugate (ADC), in patients with locally advanced or metastatic urothelial carcinoma (UC). Ann Oncol. 2024; 35(suppl_2): S1135-S1169.

Measuring Tumor Burden: Current and Emerging Approaches

January 24, 2025

Measuring Tumor Burden

Traditional endpoints in oncology clinical trials, such as progression-free survival (PFS) and overall survival (OS), while definitive, often require extended follow-up periods and substantial patient cohorts. These requirements can significantly extend development timelines and increase costs.

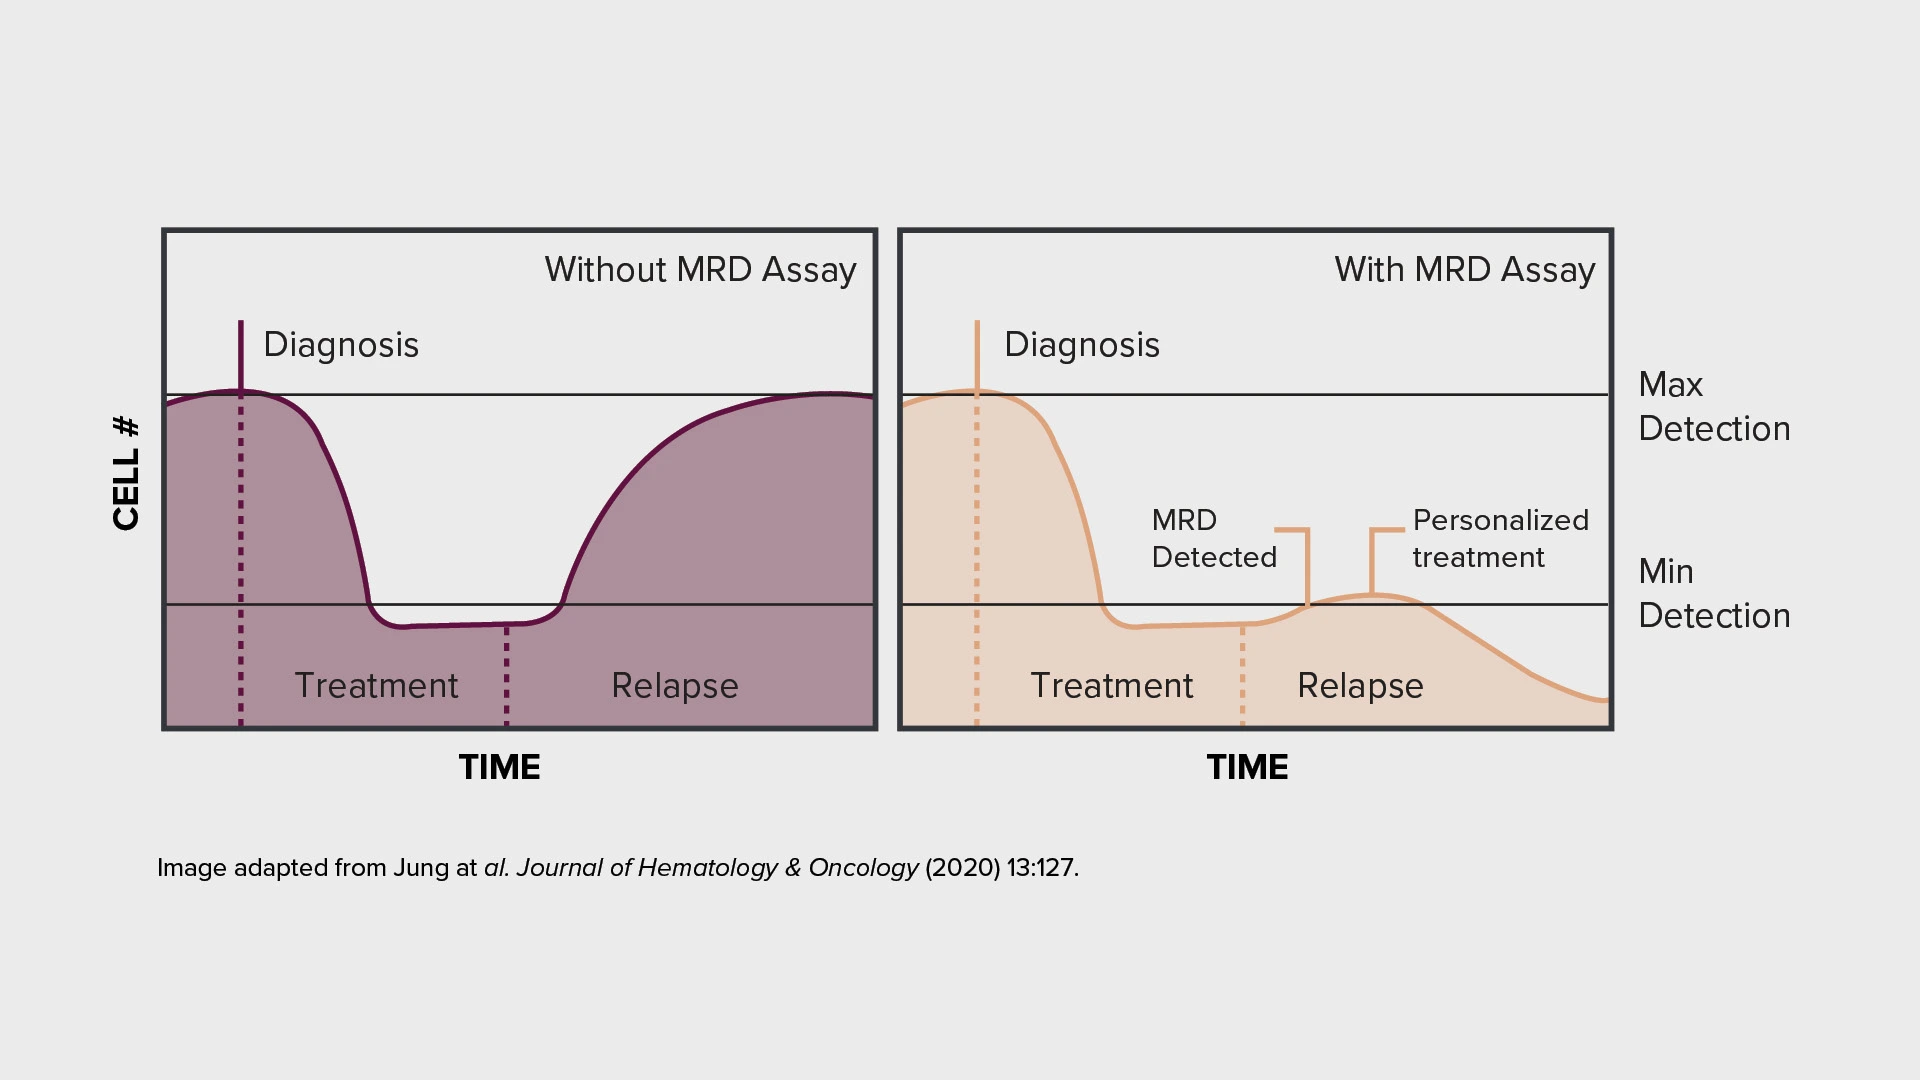
Monitoring tumor burden through measurable residual disease (MRD) assessment — measuring the presence of residual cancer cells during or after treatment — has emerged as a promising alternative, offering an early biomarker of treatment response or relapse that could accelerate clinical development decisions.

This article examines current practices and recent developments in MRD measurement across both blood and solid malignancies.

Measurable residual disease in myeloma and other blood cancers

In hematologic malignancies, MRD assessment has gained significant traction, with the FDA’s Oncologic Drugs Advisory Committee (ODAC) recently recognizing MRD as an accepted endpoint for accelerated approval in multiple myeloma studies. MRD in multiple myeloma is currently measured using a highly specific, sensitive CE-marked next-generation sequencing (NGS)-based test, clonoSEQ.

Traditionally, MRD assessment in blood cancers has relied on bone marrow (BM) extracts. However, obtaining BM extracts is an invasive and painful procedure for patients, and may no longer be necessary. In fact, recent research suggests that less-invasive liquid biopsies could be a suitable alternative.

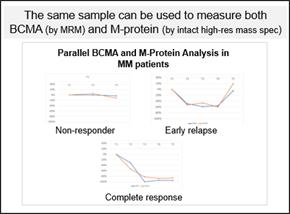
Mass spectrometry (MS) can detect soluble BCMA, a protein expressed on multiple myeloma cells, and M-protein, an abnormal protein produced by precancerous and cancerous bone marrow cells, in peripheral blood. Notably, MS applied to liquid biopsies has demonstrated greater sensitivity compared to NGS-based testing (clonoSEQ) of bone marrow extracts for M-protein detection.

MS offers the distinct advantage of tracking the specific M-protein clone produced by cancer cells and monitoring for additional clones as treatment progresses. This is facilitated by frequent sampling of peripheral blood, allowing for shorter intervals between assessments. Its high analytical range also enables the detection of signal even with reductions exceeding 90% of the original M-Protein amount, providing confidence in the quantification. The data generated by MS complements NGS-based testing and can guide decisions on further testing, including bone marrow biopsies. Importantly, MS can simultaneously measure both M-protein and BCMA from a single sample, making it an efficient tool for assessing tumor burden biomarkers.

Flow cytometry offers another approach for MRD measurement, specifically for detecting the presence of abnormal plasma cells, and can also be used to confirm target expression and identify new targets on abnormal cells. It has several advantages over NGS-based approaches for MRD measurement, including the fact that it is a standalone assay, and that there is no need to normalize to the screening timepoint and may help identify new phenotypes of abnormal cells.

Measurable residual disease in solid tumors

While MRD assessment originated in hematologic malignancies, its application in solid tumors is rapidly evolving.

Measuring MRD in solid tumors is typically done by tracking changes in levels of circulating tumor DNA (ctDNA) — DNA released into the bloodstream by dying tumor cells — using liquid biopsies, which are less invasive than tissue biopsies and enable earlier and more frequent monitoring of tumor burden. Since ctDNA originates from multiple lesions throughout the body, it also provides a more comprehensive view of tumor heterogeneity than single-site tissue biopsies.

Two main approaches have emerged for solid tumor MRD testing:

  • Tumor-informed MRD involves tracking specific known mutations identified from a patient’s tumor. This personalized approach typically monitors 10–50 variants throughout treatment. Often, NGS is used to measure tumor-informed MRD, where specific panels are preferred over whole genome sequencing approaches owing to the cost of sequencing (since cell-free DNA also contains normal DNA, and thus very deep sequencing is required to detect mutations with a low variant allele frequency (VAF) in the ctDNA). Known, specific mutations can also be measured with digital droplet PCR (ddPCR).
  • Tumor-naïve MRD examines a predefined panel of common mutations associated with treatment resistance, prognosis, or therapeutic response, and is used when a specific mutational profile of the patient’s tumor is unavailable. However, some patients may lack the common mutations in the predefined panel. NGS panels such as the TSO500 panel, the Oncomine Dx Express Test, or kits from Pillar Biosciences, are typically used for tumor-naïve MRD measurement.

The FDA recently released new guidance for those planning to use ctDNA assays for curative intent solid tumor drug development, with the guidance dedicating significant focus to ctDNA assay considerations for MRD measurement in particular.

Beyond tumor burden: investigating resistance pathways

Sequencing technologies offer value beyond MRD monitoring, too. There is a growing focus in oncology trials on understanding whether patients are developing therapeutic resistance, driven by mutations that emerge during treatment.

Advanced sequencing techniques can track these mutational changes throughout treatment, helping to identify resistance pathways and inform therapeutic adaptation. This application is currently most established in solid tumors, though it is also employed, albeit less frequently, in hematologic malignancies.

The ability to monitor mutation drift by sequencing liquid biopsies represents another powerful application of sequencing tools in personalizing cancer treatment, ensuring therapies can be adapted based on a patient’s evolving disease profile.

Optimizing clinical studies with measurable residual disease measurement


The integration of MRD assessment into clinical trials can offer earlier indication of treatment efficacy and enables more frequent disease monitoring. These capabilities can support more rapid development decisions in oncology trials.

Crucially, the field continues to evolve, with ongoing technological advances improving the sensitivity and reliability of MRD detection. A growing range of validated tools and approaches — from next-generation sequencing to mass spectrometry and flow cytometry — now provides options for accurate MRD measurement across different cancer types and clinical contexts.

Want to find out how MRD measurement could help optimize your clinical studies? Reach out to one of our experts to find out more.


About the authors:

author photo

Nathalie Bernard (PhD) is the scientific business director for the Genomic Services unit within CellCarta. Her background is in molecular biology, and she has many years of experience in PCR and sequencing, technologies used to discover or identify DNA and RNA biomarkers of clinical utility. At CellCarta, Nathalie is using her expertise to guide our customers in finding the best solution to their genomic questions.

author photo

Dr. Luca Genovesi is the Group Leader of R&D at CellCarta, where he manages a team of scientists in developing mass spectrometry-based assays to quantify biologics and biomarkers in complex matrices for clinical and pre-clinical studies. He has a strong background in Analytical Chemistry, with over 15 years of experience in the regulated pharmaceutical industry, including roles in pharmaceutical companies, CMOs, and CROs. Dr. Genovesi holds an M.Sc. in Organic Chemistry and a Ph.D. in Industrial Biotechnology from Milan University, Italy.

Measuring Tumor Burden: Current and Emerging Approaches

January 24, 2025

Measuring Tumor Burden

Traditional endpoints in oncology clinical trials, such as progression-free survival (PFS) and overall survival (OS), while definitive, often require extended follow-up periods and substantial patient cohorts. These requirements can significantly extend development timelines and increase costs.

Monitoring tumor burden through measurable residual disease (MRD) assessment — measuring the presence of residual cancer cells during or after treatment — has emerged as a promising alternative, offering an early biomarker of treatment response or relapse that could accelerate clinical development decisions.

This article examines current practices and recent developments in MRD measurement across both blood and solid malignancies.

Measurable residual disease in myeloma and other blood cancers

In hematologic malignancies, MRD assessment has gained significant traction, with the FDA’s Oncologic Drugs Advisory Committee (ODAC) recently recognizing MRD as an accepted endpoint for accelerated approval in multiple myeloma studies. MRD in multiple myeloma is currently measured using a highly specific, sensitive CE-marked next-generation sequencing (NGS)-based test, clonoSEQ.

Traditionally, MRD assessment in blood cancers has relied on bone marrow (BM) extracts. However, obtaining BM extracts is an invasive and painful procedure for patients, and may no longer be necessary. In fact, recent research suggests that less-invasive liquid biopsies could be a suitable alternative.

Mass spectrometry (MS) can detect soluble BCMA, a protein expressed on multiple myeloma cells, and M-protein, an abnormal protein produced by precancerous and cancerous bone marrow cells, in peripheral blood. Notably, MS applied to liquid biopsies has demonstrated greater sensitivity compared to NGS-based testing (clonoSEQ) of bone marrow extracts for M-protein detection.

MS offers the distinct advantage of tracking the specific M-protein clone produced by cancer cells and monitoring for additional clones as treatment progresses. This is facilitated by frequent sampling of peripheral blood, allowing for shorter intervals between assessments. Its high analytical range also enables the detection of signal even with reductions exceeding 90% of the original M-Protein amount, providing confidence in the quantification. The data generated by MS complements NGS-based testing and can guide decisions on further testing, including bone marrow biopsies. Importantly, MS can simultaneously measure both M-protein and BCMA from a single sample, making it an efficient tool for assessing tumor burden biomarkers.

Flow cytometry offers another approach for MRD measurement, specifically for detecting the presence of abnormal plasma cells, and can also be used to confirm target expression and identify new targets on abnormal cells. It has several advantages over NGS-based approaches for MRD measurement, including the fact that it is a standalone assay, and that there is no need to normalize to the screening timepoint and may help identify new phenotypes of abnormal cells.

Measurable residual disease in solid tumors

While MRD assessment originated in hematologic malignancies, its application in solid tumors is rapidly evolving.

Measuring MRD in solid tumors is typically done by tracking changes in levels of circulating tumor DNA (ctDNA) — DNA released into the bloodstream by dying tumor cells — using liquid biopsies, which are less invasive than tissue biopsies and enable earlier and more frequent monitoring of tumor burden. Since ctDNA originates from multiple lesions throughout the body, it also provides a more comprehensive view of tumor heterogeneity than single-site tissue biopsies.

Two main approaches have emerged for solid tumor MRD testing:

  • Tumor-informed MRD involves tracking specific known mutations identified from a patient’s tumor. This personalized approach typically monitors 10–50 variants throughout treatment. Often, NGS is used to measure tumor-informed MRD, where specific panels are preferred over whole genome sequencing approaches owing to the cost of sequencing (since cell-free DNA also contains normal DNA, and thus very deep sequencing is required to detect mutations with a low variant allele frequency (VAF) in the ctDNA). Known, specific mutations can also be measured with digital droplet PCR (ddPCR).
  • Tumor-naïve MRD examines a predefined panel of common mutations associated with treatment resistance, prognosis, or therapeutic response, and is used when a specific mutational profile of the patient’s tumor is unavailable. However, some patients may lack the common mutations in the predefined panel. NGS panels such as the TSO500 panel, the Oncomine Dx Express Test, or kits from Pillar Biosciences, are typically used for tumor-naïve MRD measurement.

The FDA recently released new guidance for those planning to use ctDNA assays for curative intent solid tumor drug development, with the guidance dedicating significant focus to ctDNA assay considerations for MRD measurement in particular.

Beyond tumor burden: investigating resistance pathways

Sequencing technologies offer value beyond MRD monitoring, too. There is a growing focus in oncology trials on understanding whether patients are developing therapeutic resistance, driven by mutations that emerge during treatment.

Advanced sequencing techniques can track these mutational changes throughout treatment, helping to identify resistance pathways and inform therapeutic adaptation. This application is currently most established in solid tumors, though it is also employed, albeit less frequently, in hematologic malignancies.

The ability to monitor mutation drift by sequencing liquid biopsies represents another powerful application of sequencing tools in personalizing cancer treatment, ensuring therapies can be adapted based on a patient’s evolving disease profile.

Optimizing clinical studies with measurable residual disease measurement


The integration of MRD assessment into clinical trials can offer earlier indication of treatment efficacy and enables more frequent disease monitoring. These capabilities can support more rapid development decisions in oncology trials.

Crucially, the field continues to evolve, with ongoing technological advances improving the sensitivity and reliability of MRD detection. A growing range of validated tools and approaches — from next-generation sequencing to mass spectrometry and flow cytometry — now provides options for accurate MRD measurement across different cancer types and clinical contexts.

Want to find out how MRD measurement could help optimize your clinical studies? Reach out to one of our experts to find out more.


About the authors:

author photo

Nathalie Bernard (PhD) is the scientific business director for the Genomic Services unit within CellCarta. Her background is in molecular biology, and she has many years of experience in PCR and sequencing, technologies used to discover or identify DNA and RNA biomarkers of clinical utility. At CellCarta, Nathalie is using her expertise to guide our customers in finding the best solution to their genomic questions.

author photo

Dr. Luca Genovesi is the Group Leader of R&D at CellCarta, where he manages a team of scientists in developing mass spectrometry-based assays to quantify biologics and biomarkers in complex matrices for clinical and pre-clinical studies. He has a strong background in Analytical Chemistry, with over 15 years of experience in the regulated pharmaceutical industry, including roles in pharmaceutical companies, CMOs, and CROs. Dr. Genovesi holds an M.Sc. in Organic Chemistry and a Ph.D. in Industrial Biotechnology from Milan University, Italy.

ELISpot vs. ICS: Optimizing Immune Monitoring in Clinical Trials with the Right Functional Assay

November 19, 2024

EliSpot vs ICS - Optimizing Immune Monitoring.

In clinical development, understanding how the immune response evolves upon administration of a therapeutics is often vital to assess safety and/or efficacy. While researchers have traditionally focussed primarily on humoral immunity through assessment of antibody production, the evaluation of cellular immunity has become increasingly important, driven by the need to understand both arms of the adaptive immune system. ELISpot and intracellular cytokine staining (ICS) are key functional assays used to measure the T cell immune responses in clinical trials. Understanding these techniques and selecting the most appropriate one for your application helps you generate the reliable immune response data you need for clinical development and approval.

ELISpot vs. ICS for Clinical Trials: A Tale of Two Assays

While both assays are similar in terms of stimulation protocol (e.g: pools of overlapping peptides to stimulate T cells), they each measure immune responses in a distinct way:

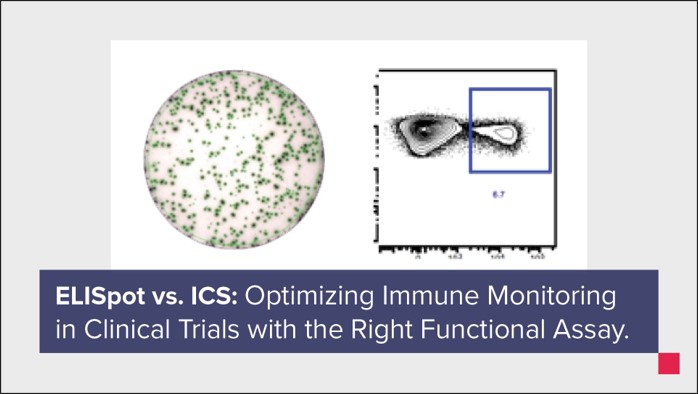
  •  ELISpot: Uses enzymatic action to measure the secretion of one cytokine captured by specific antibodies on a membrane surface, providing a precise evaluation of cell-mediated immunity. Results are typically expressed as number of spot-forming cells per million total cells.
  • ICS: Uses fluorescent antibodies to detect intracellular cytokine expression at the single-cell level by flow cytometry and combines it with phenotypic information, providing a deeper understanding of what type of T cells is responding to stimulation (e.g. CD4 and CD8, memory subsets). In addition, as more than one cytokine can be measured within a cell, it is possible to assess polyfunctionality. Results can be expressed as the count or percentage of cytokine-secreting subsets, and as relative expression levels with Median Fluorescence Intensities (MdFI). The ability to include a viability dye in the flow panel ensures that debris and dead cells are excluded from the analysis.

Both ICS and ELISpot require cryopreserved peripheral blood mononuclear cells (PBMCs) as a starting point. High-quality PBMC isolation is therefore critical for maintaining cell viability and ensuring reliable results in both assays. Table 1 below shows a side-by-side comparison of other key similarities and differences between each method to guide your assay selection.

ELISpot vs. ICS at a Glance

Table 1: Comparison of ICS and ELISpot assays.

Technique ICS ELISpot
Analyte Intracellular Secreted/Membrane spot
Matrix PBMC PBMC
Cell # per well 1-2 x 10^6 0.1-0.5 x 10^6
Clinical endpoint and clinical phase • Exploratory, secondary, primary
• All clinical phases
• Exploratory, secondary, primary
• All clinical phases
Complexity level
Assay development/validation High High
Pre-analytical variables Mid High
Assay background Mid High
Data analysis High Low
Measurements • Multiple cytokines
• Cellular phenotype
• Individual cytokine in separate assay
Multiplexing capability High level: 16 color panel (conventional cytometry), 30+ color panel (spectral/CyTOF) Singleplex (possible to multiplex with Fluorospot)
Sensitivity Similar Similar

When to Use ICS and ELISpot

One of the key factors to consider when choosing between ELISpot and ICS is the level of detail required for immune response monitoring. Both assays offer unique advantages for different research goals.

Use ELISpot for Focused Cytokine Measurement in Well-Characterized Systems

ELISpot is ideal for measuring one or two cytokines at the single cell level. While it cannot identify which specific immune cells are producing the cytokines, ELISpot’s high sensitivity and simplicity of readout make it well suited for trials focused on specific immune markers. The sensitivity is, however, highly dependent on the quality of PBMCs.

Use ICS for Multiplexing and Immune Cell Phenotyping

ICS is best suited to research aiming to understand the phenotype of cytokine-producing cells and explore complex immune responses such as polyfunctionality. With its ability to multiplex—measuring several cytokines simultaneously—and provide detailed information about the cell types involved, ICS is particularly valuable in trials where you suspect the immune response may vary depending on the circumstances (e.g. switch of responding memory population during treatment or heterogenous disease etiology).

Leveraging the best of both assays

ELISpot and ICS assays can be combined in a two-step strategy to deeply characterize immune responses in a selection of clinical trial samples. In this perspective, the ELISpot assay can first be used as a screening tool to assess uncharacterized samples and define the ones (subjects/timepoints) that warrant further investigation to support clinical development. A comprehensive ICS panel can then be deployed on these samples to provide deeper knowledge about the polyfunctionality and phenotype of responding cells.

Dispelling Common Immune Response Assay Myths

Misconceptions about ELISpot and ICS often lead to missed opportunities in choosing the most effective assay for your clinical trial. Below we address some of the most common misconceptions to help you make informed decisions.

Myth 1: ICS Requires More Cells than ELISpot

Although the ELISpot assay requires fewer cells per well relative to the ICS assay, it is often ran in triplicate analysis for each condition tested, whereas ICS is usually ran as a single replicate. Therefore, the total number of cells required for both assays will be similar.

Myth 2: ELISpot is More Sensitive than ICS

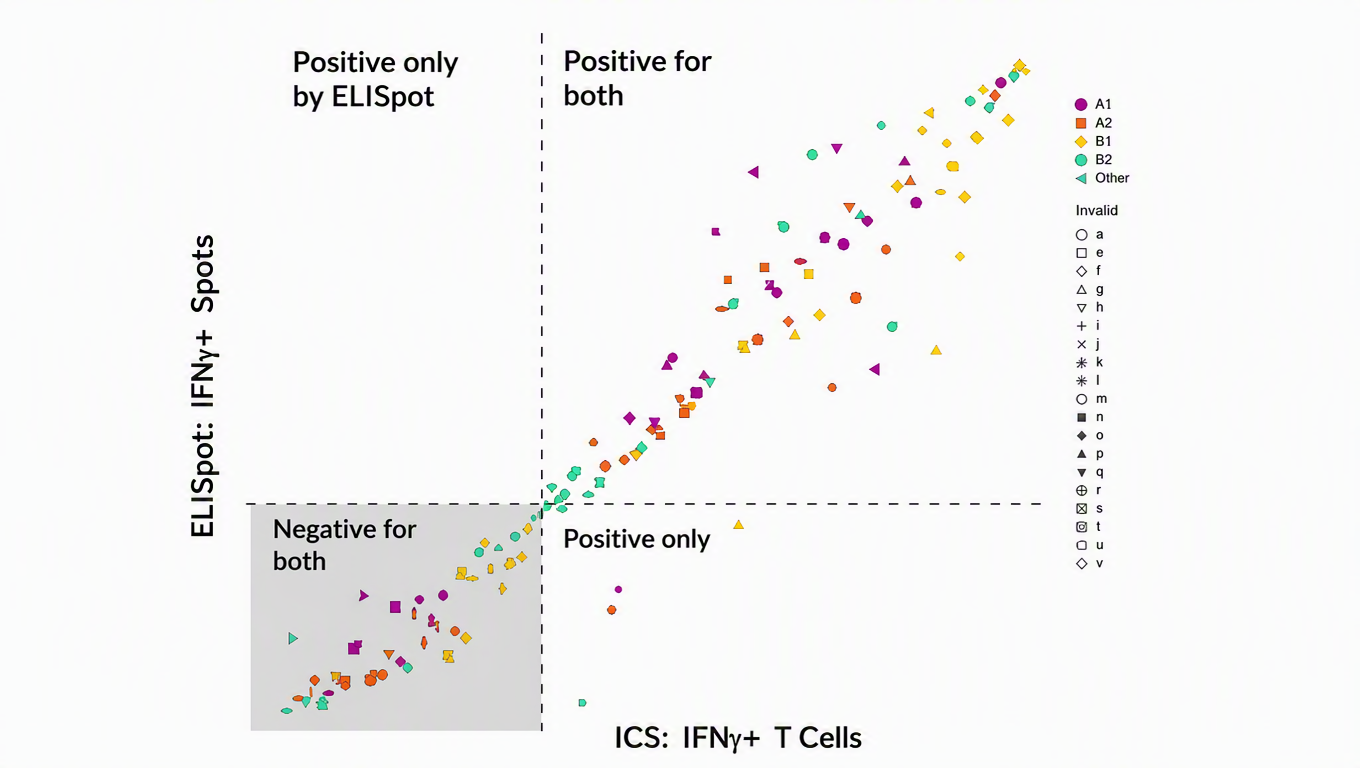
A development test measuring IFN-γ spot count for ELISpot and IFN-γ T cell response (CD3+) for ICS (as shown in Figure 1) clearly shows that both assays identified the same negative and positive responders, demonstrating similar sensitivity levels. Positive responders were not identified by ELISpot only.

Figure 1: Colors indicate different simulation conditions, and shapes represent donor response. Both assays identified the same negative and positive responders.

Myth 3: ELISpot is More Reliable than ICS

Although often considered the method of choice, ELISpot can face issues with high background levels affecting reproducibility and sensitivity. This challenge is not present with ICS since debris/dead cells are gated out through the use of cellular viability markers and scatter profiles.

Drive Your Immune Response Monitoring Success with CellCarta’s Expertise

ELISpot and ICS each play distinct roles in assessing cellular immune responses, with each assay suited to different applications. ICS’s multiplexing and phenotypic information allows it to provide detailed immune profiling, while ELISpot’s targeted approach make it ideal for measuring specific immune markers. The key is knowing when to use each assay based on your clinical goals.

By measuring immune cell responses through cytokine production, ELISpot and ICS serve as valuable functional assays. When paired with complementary technologies like Olink and MSD for comprehensive protein analysis in serum or plasma, they offer a robust framework to understand immune responses in clinical trials.

At CellCarta, we provide expertise and tools to help you navigate this decision and deliver reliable results. Our team has the experience and facilities to deliver high-quality ELISpot and ICS services, from technically challenging PBMC isolation to the use of advanced data analysis tools like CellEngine®, which provides fast analysis, collaborative features, and advanced visualization capabilities. We simplify the complexity of ELISpot and ICS from start to finish.

Unlock deeper insights into your clinical trials with our expert ICS services. Partner with us today to elevate your immune monitoring strategy.

Meet our experts

author photo

Céline Vandamme is a Scientific Business Director at CellCarta, specializing in the flow cytometry platform. With a PhD in immunology, and a broad expertise gained through her work at various academic and pharmaceutical institutions, Céline has profuse experience in designing flow cytometry assays to support immune monitoring activities in clinical trials.

author photo


Damien Montamat-Sicotte is a Scientific Business Director at CellCarta, specializing in the flow Cytometry platform. With a PhD in immunology and post-doctoral expertise from various institutions, Damien has profuse experience in managing the processing and analysis of clinical samples by flow cytometry in an immune monitoring context.

ELISpot vs. ICS: Optimizing Immune Monitoring in Clinical Trials with the Right Functional Assay

November 19, 2024

EliSpot vs ICS - Optimizing Immune Monitoring.

In clinical development, understanding how the immune response evolves upon administration of a therapeutics is often vital to assess safety and/or efficacy. While researchers have traditionally focussed primarily on humoral immunity through assessment of antibody production, the evaluation of cellular immunity has become increasingly important, driven by the need to understand both arms of the adaptive immune system. ELISpot and intracellular cytokine staining (ICS) are key functional assays used to measure the T cell immune responses in clinical trials. Understanding these techniques and selecting the most appropriate one for your application helps you generate the reliable immune response data you need for clinical development and approval.

ELISpot vs. ICS for Clinical Trials: A Tale of Two Assays

While both assays are similar in terms of stimulation protocol (e.g: pools of overlapping peptides to stimulate T cells), they each measure immune responses in a distinct way:

  •  ELISpot: Uses enzymatic action to measure the secretion of one cytokine captured by specific antibodies on a membrane surface, providing a precise evaluation of cell-mediated immunity. Results are typically expressed as number of spot-forming cells per million total cells.
  • ICS: Uses fluorescent antibodies to detect intracellular cytokine expression at the single-cell level by flow cytometry and combines it with phenotypic information, providing a deeper understanding of what type of T cells is responding to stimulation (e.g. CD4 and CD8, memory subsets). In addition, as more than one cytokine can be measured within a cell, it is possible to assess polyfunctionality. Results can be expressed as the count or percentage of cytokine-secreting subsets, and as relative expression levels with Median Fluorescence Intensities (MdFI). The ability to include a viability dye in the flow panel ensures that debris and dead cells are excluded from the analysis.

Both ICS and ELISpot require cryopreserved peripheral blood mononuclear cells (PBMCs) as a starting point. High-quality PBMC isolation is therefore critical for maintaining cell viability and ensuring reliable results in both assays. Table 1 below shows a side-by-side comparison of other key similarities and differences between each method to guide your assay selection.

ELISpot vs. ICS at a Glance

Table 1: Comparison of ICS and ELISpot assays.

Technique ICS ELISpot
Analyte Intracellular Secreted/Membrane spot
Matrix PBMC PBMC
Cell # per well 1-2 x 10^6 0.1-0.5 x 10^6
Clinical endpoint and clinical phase • Exploratory, secondary, primary
• All clinical phases
• Exploratory, secondary, primary
• All clinical phases
Complexity level
Assay development/validation High High
Pre-analytical variables Mid High
Assay background Mid High
Data analysis High Low
Measurements • Multiple cytokines
• Cellular phenotype
• Individual cytokine in separate assay
Multiplexing capability High level: 16 color panel (conventional cytometry), 30+ color panel (spectral/CyTOF) Singleplex (possible to multiplex with Fluorospot)
Sensitivity Similar Similar

When to Use ICS and ELISpot

One of the key factors to consider when choosing between ELISpot and ICS is the level of detail required for immune response monitoring. Both assays offer unique advantages for different research goals.

Use ELISpot for Focused Cytokine Measurement in Well-Characterized Systems

ELISpot is ideal for measuring one or two cytokines at the single cell level. While it cannot identify which specific immune cells are producing the cytokines, ELISpot’s high sensitivity and simplicity of readout make it well suited for trials focused on specific immune markers. The sensitivity is, however, highly dependent on the quality of PBMCs.

Use ICS for Multiplexing and Immune Cell Phenotyping

ICS is best suited to research aiming to understand the phenotype of cytokine-producing cells and explore complex immune responses such as polyfunctionality. With its ability to multiplex—measuring several cytokines simultaneously—and provide detailed information about the cell types involved, ICS is particularly valuable in trials where you suspect the immune response may vary depending on the circumstances (e.g. switch of responding memory population during treatment or heterogenous disease etiology).

Leveraging the best of both assays

ELISpot and ICS assays can be combined in a two-step strategy to deeply characterize immune responses in a selection of clinical trial samples. In this perspective, the ELISpot assay can first be used as a screening tool to assess uncharacterized samples and define the ones (subjects/timepoints) that warrant further investigation to support clinical development. A comprehensive ICS panel can then be deployed on these samples to provide deeper knowledge about the polyfunctionality and phenotype of responding cells.

Dispelling Common Immune Response Assay Myths

Misconceptions about ELISpot and ICS often lead to missed opportunities in choosing the most effective assay for your clinical trial. Below we address some of the most common misconceptions to help you make informed decisions.

Myth 1: ICS Requires More Cells than ELISpot

Although the ELISpot assay requires fewer cells per well relative to the ICS assay, it is often ran in triplicate analysis for each condition tested, whereas ICS is usually ran as a single replicate. Therefore, the total number of cells required for both assays will be similar.

Myth 2: ELISpot is More Sensitive than ICS

A development test measuring IFN-γ spot count for ELISpot and IFN-γ T cell response (CD3+) for ICS (as shown in Figure 1) clearly shows that both assays identified the same negative and positive responders, demonstrating similar sensitivity levels. Positive responders were not identified by ELISpot only.

Figure 1: Colors indicate different simulation conditions, and shapes represent donor response. Both assays identified the same negative and positive responders.

Myth 3: ELISpot is More Reliable than ICS

Although often considered the method of choice, ELISpot can face issues with high background levels affecting reproducibility and sensitivity. This challenge is not present with ICS since debris/dead cells are gated out through the use of cellular viability markers and scatter profiles.

Drive Your Immune Response Monitoring Success with CellCarta’s Expertise

ELISpot and ICS each play distinct roles in assessing cellular immune responses, with each assay suited to different applications. ICS’s multiplexing and phenotypic information allows it to provide detailed immune profiling, while ELISpot’s targeted approach make it ideal for measuring specific immune markers. The key is knowing when to use each assay based on your clinical goals.

By measuring immune cell responses through cytokine production, ELISpot and ICS serve as valuable functional assays. When paired with complementary technologies like Olink and MSD for comprehensive protein analysis in serum or plasma, they offer a robust framework to understand immune responses in clinical trials.

At CellCarta, we provide expertise and tools to help you navigate this decision and deliver reliable results. Our team has the experience and facilities to deliver high-quality ELISpot and ICS services, from technically challenging PBMC isolation to the use of advanced data analysis tools like CellEngine®, which provides fast analysis, collaborative features, and advanced visualization capabilities. We simplify the complexity of ELISpot and ICS from start to finish.

Unlock deeper insights into your clinical trials with our expert ICS services. Partner with us today to elevate your immune monitoring strategy.

Meet our experts

author photo

Céline Vandamme is a Scientific Business Director at CellCarta, specializing in the flow cytometry platform. With a PhD in immunology, and a broad expertise gained through her work at various academic and pharmaceutical institutions, Céline has profuse experience in designing flow cytometry assays to support immune monitoring activities in clinical trials.
author photo


Damien Montamat-Sicotte is a Scientific Business Director at CellCarta, specializing in the flow Cytometry platform. With a PhD in immunology and post-doctoral expertise from various institutions, Damien has profuse experience in managing the processing and analysis of clinical samples by flow cytometry in an immune monitoring context.