Flow Cytometry Applications

October 17, 2024

Flow cytometry is a technique used to measure the physical and chemical characteristics of cells or particles as they flow in a fluid stream through a beam of light. By labeling cells with fluorescent markers, flow cytometry can analyze multiple parameters simultaneously, providing a comprehensive profile of each cell.

This guide explores flow cytometry applications and various uses, providing insights into its significance in clinical research.

About Flow Cytometry and Its Impact

Flow cytometry integrates principles and techniques from electronics, fluidics, and optics. Samples stained with fluorescent labelled antibodies are suspended in fluid and injected into the flow cytometer.

As cells pass through a laser beam, they scatter light and emit fluorescence that is detected and measured. This data provides detailed information about the cell’s properties, including size, complexity, and the presence of specific markers, allowing to determine a cell’s phenotype and confirm protein expression either extra- or intra-cellular.

Flow Cytometry in Research and Clinical Settings

Flow cytometry offers several advantages, including:

  • High-throughput single-cell analysis: Ability to analyze thousands of cells per second.
  • Multiparametric data: Simultaneous measurement of multiple parameters and confirm protein expression.
  • Precision and sensitivity: Detection of rare cell populations.

These features make flow cytometry an essential tool in various fields, from basic research to therapeutic monitoring.

For example, in immunology, it can be used to analyze the distribution and characteristics of different immune cell types, aiding in the understanding of immune responses and potential therapeutic targets.

Learn more about:

Flow Cytometry platforms and services by CellCarta

10 Key Applications and Uses of Flow Cytometry

1- Clinical Monitoring

Hematological Malignancies:

Flow cytometry is instrumental in monitoring blood cancers such as leukemia and lymphoma. It identifies abnormal cells based on their surface markers, enabling precise disease classification and monitoring.

For example, the flow cytometry platform allows for the measurement of minimal residual disease (MRD) in leukemia patients, helping understand treatment responses.

Immunophenotyping:

This application identifies and quantifies different immune cell populations, aiding in the phenotyping of immune disorders. Flow cytometry can detect specific markers on the surface of immune cells, providing detailed information on immune status.

CellCarta’s platform agnostic expertise in flow cytometry, whether conventional, mass or spectral, allows for immunophenotyping tailored to the project’s need.

Basophil Activation Test (BAT):

The Basophil Activation Test (BAT) is frequently employed to measure allergy severity and assess clinical responses to immunomodulatory treatments. Flow cytometry enable the precise monitoring of the basophil population by analysing degranulation markers such as CD63.

2- Cell Sorting and Cell Isolation

Flow cytometers equipped with sorting capabilities can physically separate specific cell populations from a mixed sample. This is crucial for research applications requiring pure cell populations, such as stem cell research or cancer studies.

For example, CellCarta‘s advanced flow cytometry techniques facilitate the isolation of rare cell populations for downstream, phenotypic, functional, genomic and proteomic analyses.

3- Cell Cycle Analysis- Assessing Cell Replication States

Flow cytometry analyzes cell cycle phases, helping researchers understand cell proliferation and apoptosis.

This is particularly important in cancer research, where cell cycle dysregulation is a hallmark of disease. By measuring DNA content and identifying different phases of the cell cycle, researchers can evaluate the effects of anticancer drugs and understand tumor growth dynamics.

Cell proliferation assays to measuring Cellular Metabolic Activity: These assays evaluate cell division and growth in response to various stimuli. Flow cytometry tracks cell proliferation by labelling cells with a fluorescent dye, providing insights into cellular responses and drug efficacy.

4- Apoptosis and Necrosis Detection

Flow cytometry distinguishes between apoptosis (programmed cell death) and necrosis (cell death due to injury).

This is vital for studying cellular responses to treatments and understanding disease mechanisms.

For example, in drug development, determining whether a compound induces apoptosis or necrosis can inform its potential therapeutic value.

5- Immune System Monitoring

Tracking Immune Cell Populations:

Flow cytometry monitors changes in immune cell populations, such as:

  • CD4 and CD8 T cells, in patients with HIV.
  • Naïve and memory B cells in auto-immune patients following treatment and reset of their B cell populations (immune reset hypothesis).

This information is crucial for assessing disease progression and treatment efficacy. Regular monitoring helps clinicians adjust therapies to maintain immune function and manage the disease effectively.

6- Cancer Research- Analyzing Tumor-Infiltrating Lymphocytes (TILs)

Flow cytometry examines immune cells within the tumor microenvironment, aiding in immunotherapy research.

This application helps identify how immune cells interact with cancer cells, providing insights into tumor immunity and helping develop strategies to enhance immune responses against tumors.

7- Blood and Platelet Analysis

Evaluating Platelet Function: Flow cytometry assesses platelet activity and function, important for diagnosing and managing clotting disorders.

This technology provides detailed information on platelet count, activation, and aggregation, aiding in the diagnosis of conditions like thrombocytopenia and platelet function disorders.

8- Stem Cell Research

Identifying and Sorting Stem Cells: Flow cytometry is essential to identify and isolate stem cells based on specific surface markers.

This application is crucial for regenerative medicine and stem cell therapy research, where pure populations of stem cells are needed for developing treatments for various conditions, including neurodegenerative diseases and tissue injuries.

9- Microbiology and Virology

Pathogen Detection: Flow cytometry detects and quantifies bacteria, viruses, and other pathogens in clinical samples. This is vital for infectious disease research and diagnostics, providing rapid and accurate pathogen identification.

For instance, it can be used to monitor bacterial contamination in water supplies or to detect viral infections in patient samples.

10- Drug Development and Toxicology

Flow cytometry assesses how drugs impact cell populations, viability, and function. This application is crucial for drug discovery and safety assessments, helping to screen potential therapeutic agents for efficacy and toxicity.

By measuring parameters such as cell viability, apoptosis, and proliferation, researchers can determine the effects of new drugs on different cell types.

Using specifically antibodies against intra-cellular phosphorylated biomarkers (phosphoflow) allows the monitoring of signaling pathways. With the profiling of key signaling pathways using phosphoflow, drug developer get a better understanding of their compound’s mechanism of action.

Explore all our Flow Cytometry Services and Platform

Considerations when developing Flow Cytometry projects

Flow cytometry’s ability to provide detailed analysis of cell populations makes it indispensable in clinical research. With the power to confirm protein expression in specific cell types at a single-cell level, its applications span various fields.

Flow cytometry has revolutionized many aspects of biomedical research and clinical practice. Its applications in immunology, oncology, microbiology, and infectious diseases have led to significant drug discoveries and innovations. For example, flow cytometry has played a crucial role in the development of immunotherapies for cancer, enabling researchers to understand how immune cells interact with tumors and identify new therapeutic targets.

Flow cytometry is a versatile technology in modern science that offers numerous applications in clinical research and therapeutic monitoring. Here we provided a quick highlight of about 10 key applications and uses with helpful insights and links to our Flow Cytometry services.

Learn about CellCarta and all our solutions.

About the author: 

author photo

Damien Montamat-Sicotte is a Scientific Business Director at CellCarta, specializing in the flow Cytometry platform. With a PhD in immunology and post-doctoral expertise from various institutions, Damien has profuse experience in managing the processing and analysis of clinical samples by flow cytometry in an immune monitoring context.

Flow Cytometry Applications

October 17, 2024

Flow cytometry is a technique used to measure the physical and chemical characteristics of cells or particles as they flow in a fluid stream through a beam of light. By labeling cells with fluorescent markers, flow cytometry can analyze multiple parameters simultaneously, providing a comprehensive profile of each cell.

This guide explores flow cytometry applications and various uses, providing insights into its significance in clinical research.

About Flow Cytometry and Its Impact

Flow cytometry integrates principles and techniques from electronics, fluidics, and optics. Samples stained with fluorescent labelled antibodies are suspended in fluid and injected into the flow cytometer.

As cells pass through a laser beam, they scatter light and emit fluorescence that is detected and measured. This data provides detailed information about the cell’s properties, including size, complexity, and the presence of specific markers, allowing to determine a cell’s phenotype and confirm protein expression either extra- or intra-cellular.

Flow Cytometry in Research and Clinical Settings

Flow cytometry offers several advantages, including:

  • High-throughput single-cell analysis: Ability to analyze thousands of cells per second.
  • Multiparametric data: Simultaneous measurement of multiple parameters and confirm protein expression.
  • Precision and sensitivity: Detection of rare cell populations.

These features make flow cytometry an essential tool in various fields, from basic research to therapeutic monitoring.

For example, in immunology, it can be used to analyze the distribution and characteristics of different immune cell types, aiding in the understanding of immune responses and potential therapeutic targets.

Learn more about:

Flow Cytometry platforms and services by CellCarta

10 Key Applications and Uses of Flow Cytometry

1- Clinical Monitoring

Hematological Malignancies:

Flow cytometry is instrumental in monitoring blood cancers such as leukemia and lymphoma. It identifies abnormal cells based on their surface markers, enabling precise disease classification and monitoring.

For example, the flow cytometry platform allows for the measurement of minimal residual disease (MRD) in leukemia patients, helping understand treatment responses.

Immunophenotyping:

This application identifies and quantifies different immune cell populations, aiding in the phenotyping of immune disorders. Flow cytometry can detect specific markers on the surface of immune cells, providing detailed information on immune status.

CellCarta’s platform agnostic expertise in flow cytometry, whether conventional, mass or spectral, allows for immunophenotyping tailored to the project’s need.

Basophil Activation Test (BAT):

The Basophil Activation Test (BAT) is frequently employed to measure allergy severity and assess clinical responses to immunomodulatory treatments. Flow cytometry enable the precise monitoring of the basophil population by analysing degranulation markers such as CD63.

2- Cell Sorting and Cell Isolation

Flow cytometers equipped with sorting capabilities can physically separate specific cell populations from a mixed sample. This is crucial for research applications requiring pure cell populations, such as stem cell research or cancer studies.

For example, CellCarta‘s advanced flow cytometry techniques facilitate the isolation of rare cell populations for downstream, phenotypic, functional, genomic and proteomic analyses.

3- Cell Cycle Analysis- Assessing Cell Replication States

Flow cytometry analyzes cell cycle phases, helping researchers understand cell proliferation and apoptosis.

This is particularly important in cancer research, where cell cycle dysregulation is a hallmark of disease. By measuring DNA content and identifying different phases of the cell cycle, researchers can evaluate the effects of anticancer drugs and understand tumor growth dynamics.

Cell proliferation assays to measuring Cellular Metabolic Activity: These assays evaluate cell division and growth in response to various stimuli. Flow cytometry tracks cell proliferation by labelling cells with a fluorescent dye, providing insights into cellular responses and drug efficacy.

4- Apoptosis and Necrosis Detection

Flow cytometry distinguishes between apoptosis (programmed cell death) and necrosis (cell death due to injury).

This is vital for studying cellular responses to treatments and understanding disease mechanisms.

For example, in drug development, determining whether a compound induces apoptosis or necrosis can inform its potential therapeutic value.

5- Immune System Monitoring

Tracking Immune Cell Populations:

Flow cytometry monitors changes in immune cell populations, such as:

  • CD4 and CD8 T cells, in patients with HIV.
  • Naïve and memory B cells in auto-immune patients following treatment and reset of their B cell populations (immune reset hypothesis).

This information is crucial for assessing disease progression and treatment efficacy. Regular monitoring helps clinicians adjust therapies to maintain immune function and manage the disease effectively.

6- Cancer Research- Analyzing Tumor-Infiltrating Lymphocytes (TILs)

Flow cytometry examines immune cells within the tumor microenvironment, aiding in immunotherapy research.

This application helps identify how immune cells interact with cancer cells, providing insights into tumor immunity and helping develop strategies to enhance immune responses against tumors.

7- Blood and Platelet Analysis

Evaluating Platelet Function: Flow cytometry assesses platelet activity and function, important for diagnosing and managing clotting disorders.

This technology provides detailed information on platelet count, activation, and aggregation, aiding in the diagnosis of conditions like thrombocytopenia and platelet function disorders.

8- Stem Cell Research

Identifying and Sorting Stem Cells: Flow cytometry is essential to identify and isolate stem cells based on specific surface markers.

This application is crucial for regenerative medicine and stem cell therapy research, where pure populations of stem cells are needed for developing treatments for various conditions, including neurodegenerative diseases and tissue injuries.

9- Microbiology and Virology

Pathogen Detection: Flow cytometry detects and quantifies bacteria, viruses, and other pathogens in clinical samples. This is vital for infectious disease research and diagnostics, providing rapid and accurate pathogen identification.

For instance, it can be used to monitor bacterial contamination in water supplies or to detect viral infections in patient samples.

10- Drug Development and Toxicology

Flow cytometry assesses how drugs impact cell populations, viability, and function. This application is crucial for drug discovery and safety assessments, helping to screen potential therapeutic agents for efficacy and toxicity.

By measuring parameters such as cell viability, apoptosis, and proliferation, researchers can determine the effects of new drugs on different cell types.

Using specifically antibodies against intra-cellular phosphorylated biomarkers (phosphoflow) allows the monitoring of signaling pathways. With the profiling of key signaling pathways using phosphoflow, drug developer get a better understanding of their compound’s mechanism of action.

Explore all our Flow Cytometry Services and Platform

Considerations when developing Flow Cytometry projects

Flow cytometry’s ability to provide detailed analysis of cell populations makes it indispensable in clinical research. With the power to confirm protein expression in specific cell types at a single-cell level, its applications span various fields.

Flow cytometry has revolutionized many aspects of biomedical research and clinical practice. Its applications in immunology, oncology, microbiology, and infectious diseases have led to significant drug discoveries and innovations. For example, flow cytometry has played a crucial role in the development of immunotherapies for cancer, enabling researchers to understand how immune cells interact with tumors and identify new therapeutic targets.

Flow cytometry is a versatile technology in modern science that offers numerous applications in clinical research and therapeutic monitoring. Here we provided a quick highlight of about 10 key applications and uses with helpful insights and links to our Flow Cytometry services.

Learn about CellCarta and all our solutions.

About the author: 

author photo

Damien Montamat-Sicotte is a Scientific Business Director at CellCarta, specializing in the flow Cytometry platform. With a PhD in immunology and post-doctoral expertise from various institutions, Damien has profuse experience in managing the processing and analysis of clinical samples by flow cytometry in an immune monitoring context.
Single-Cell Analysis: A Key to Cell Therapy Testing

October 11, 2024

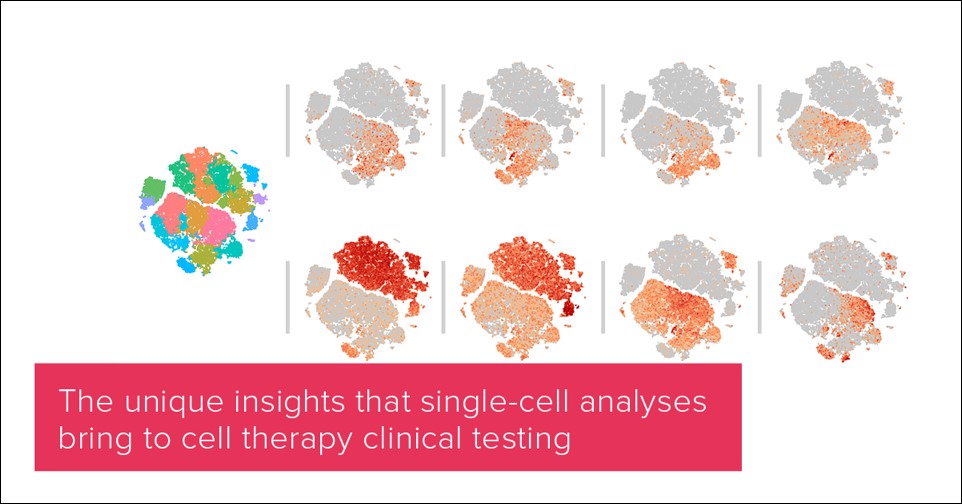
The landscape of cell therapy targets and approaches is rapidly expanding and diversifying. As a result, clinical testing is evolving. Testing programs must characterize increasingly complex and varied cell products in a quest to usher novel treatments from development through clinical approval.

Our Cell Therapy Trends Report explores this adaptation to accurately evaluate next-generation cell therapies while meeting budget and time constraints. With sights on emerging methods, it describes the notable role of single-cell analysis in unlocking efficacy and adverse events prediction. Here, we describe the recent progression of single-cell analyses and why they are needed to advance cell therapies.

“Single-cell” comes into its own

For 400 years, since the birth of the microscope, scientists have been studying the behavior of individual cells to understand how organisms function. In recent years, technology for single-cell analysis has exploded.

Fluorescence microscopy was pioneered in 1904, flow-based coulter counting in 1954, and fluorescent flow cytometry in 1968. While just two fluorescent dyes were available in the 1970s, by the early 2000s dozens of dyes enabled measurement of 20 proteins per cell over millions of cells.

The next two decades brought mass cytometry, followed by spectral flow cytometry, expanding to 40+ proteins per cell. With the debut of single-cell RNA sequencing in 2009 and CITE-seq in 2017, 1000s of transcripts alongside 100+ proteins can now be measured in each cell of a biological sample.

As single-cell analysis has advanced, human biology has proven ever more complex. Many groups are developing comprehensive single-cell atlases, which have defined 100s of different cell types across diverse tissues and diseases. Within each cell type, an array of dynamic cellular states are exhibited as cells respond to events like infection, injury, or drug treatment. This ever-growing appreciation of just how heterogeneous human biology is has made high plex single-cell analysis critical for understanding human health.

Single-cell analytics for cell therapies

As a living drug product, cell therapies are intrinsically more heterogeneous than conventional small molecules and biologics. The starting material used to manufacture a cell therapy product varies from person to person with age, genetic background, lifestyle, comorbidities, and pathogen exposure history.

Immune cells – both before and after their transformation into a cell product – can now be characterized in detail at the single-cell level, not with bulk methods that average heterogeneity and obscure rare subpopulations. Such data can help pinpoint specific immune features to use as predictive biomarkers of therapeutic efficacy or toxicity.

Additionally, next-generation cell therapies increasingly contain multiple engineered components, each with a mode of action designed to improve the overall therapeutic index. The multiplexed, multi-omic nature of today’s single-cell techniques allows each component to be characterized and linked to clinical outcomes.

Navigate single-cell insights with certainty

With various single-cell techniques at your disposal, the pressing question is how to use them efficiently. Measurements are highly specialized and costly. Deep data analysis is time-consuming. The following are a few steps to optimally use single-cell analyses in the evaluation of cell therapies:

  • Use high plex, multi-omic analyses in early-phase clinical studies to help develop a focused, lower plex biomarker strategy for late-phase trials
  • Leverage the breadth of single-cell analyses to generate hypotheses about the mechanistic behavior of therapeutic cells or for retrospective analysis of key clinical trial subgroups
  • Stay abreast of advances in large data analytics as they shift from pattern identification in single datasets to biological interpretation and cross-study comparability

Our Cell Therapy Trends Report delves deeper into the developments we anticipate in single-cell analysis and how it fits into a broader program for cell therapy clinical testing. Download the full report or speak to our team about your cell therapy.


About the Author:

author photo

Matt Clutter (PhD) is the Global Director of CellCarta’s R&D group. With a strong background in the discovery and translational immunology space, Matt has powered innovation in our flow and mass cytometry assays and data analysis approaches. With his expertise in single-cell analysis, he guides our customers in finding the best solution to their immunology questions.


Single-Cell Analysis: A Key to Cell Therapy Testing

October 11, 2024

The landscape of cell therapy targets and approaches is rapidly expanding and diversifying. As a result, clinical testing is evolving. Testing programs must characterize increasingly complex and varied cell products in a quest to usher novel treatments from development through clinical approval.

Our Cell Therapy Trends Report explores this adaptation to accurately evaluate next-generation cell therapies while meeting budget and time constraints. With sights on emerging methods, it describes the notable role of single-cell analysis in unlocking efficacy and adverse events prediction. Here, we describe the recent progression of single-cell analyses and why they are needed to advance cell therapies.

“Single-cell” comes into its own

For 400 years, since the birth of the microscope, scientists have been studying the behavior of individual cells to understand how organisms function. In recent years, technology for single-cell analysis has exploded.

Fluorescence microscopy was pioneered in 1904, flow-based coulter counting in 1954, and fluorescent flow cytometry in 1968. While just two fluorescent dyes were available in the 1970s, by the early 2000s dozens of dyes enabled measurement of 20 proteins per cell over millions of cells.

The next two decades brought mass cytometry, followed by spectral flow cytometry, expanding to 40+ proteins per cell. With the debut of single-cell RNA sequencing in 2009 and CITE-seq in 2017, 1000s of transcripts alongside 100+ proteins can now be measured in each cell of a biological sample.

As single-cell analysis has advanced, human biology has proven ever more complex. Many groups are developing comprehensive single-cell atlases, which have defined 100s of different cell types across diverse tissues and diseases. Within each cell type, an array of dynamic cellular states are exhibited as cells respond to events like infection, injury, or drug treatment. This ever-growing appreciation of just how heterogeneous human biology is has made high plex single-cell analysis critical for understanding human health.

Single-cell analytics for cell therapies

As a living drug product, cell therapies are intrinsically more heterogeneous than conventional small molecules and biologics. The starting material used to manufacture a cell therapy product varies from person to person with age, genetic background, lifestyle, comorbidities, and pathogen exposure history.

Immune cells – both before and after their transformation into a cell product – can now be characterized in detail at the single-cell level, not with bulk methods that average heterogeneity and obscure rare subpopulations. Such data can help pinpoint specific immune features to use as predictive biomarkers of therapeutic efficacy or toxicity.

Additionally, next-generation cell therapies increasingly contain multiple engineered components, each with a mode of action designed to improve the overall therapeutic index. The multiplexed, multi-omic nature of today’s single-cell techniques allows each component to be characterized and linked to clinical outcomes.

Navigate single-cell insights with certainty

With various single-cell techniques at your disposal, the pressing question is how to use them efficiently. Measurements are highly specialized and costly. Deep data analysis is time-consuming. The following are a few steps to optimally use single-cell analyses in the evaluation of cell therapies:

  • Use high plex, multi-omic analyses in early-phase clinical studies to help develop a focused, lower plex biomarker strategy for late-phase trials
  • Leverage the breadth of single-cell analyses to generate hypotheses about the mechanistic behavior of therapeutic cells or for retrospective analysis of key clinical trial subgroups
  • Stay abreast of advances in large data analytics as they shift from pattern identification in single datasets to biological interpretation and cross-study comparability

Our Cell Therapy Trends Report delves deeper into the developments we anticipate in single-cell analysis and how it fits into a broader program for cell therapy clinical testing. Download the full report or speak to our team about your cell therapy.


About the Author:

author photo

Matt Clutter (PhD) is the Global Director of CellCarta’s R&D group. With a strong background in the discovery and translational immunology space, Matt has powered innovation in our flow and mass cytometry assays and data analysis approaches. With his expertise in single-cell analysis, he guides our customers in finding the best solution to their immunology questions.


Ensure Consistent Flow Cytometry & Optimize Clinical Trials

September 18, 2024

As more novel therapeutics have entered the drug development pipeline in recent years, flow cytometry has become a core analytical method for characterizing cells, molecules, and biomarkers for therapy evaluation. The technique is especially effective at assessing drugs targeting the immune system, and therefore particularly valuable in the areas of autoimmunity, oncology, and infectious diseases.

However, drug developers face a key challenge when using flow cytometry in clinical research: consistency. Why is this a hurdle, and how can we overcome it?

The challenges of using flow cytometry for clinical trial analysis

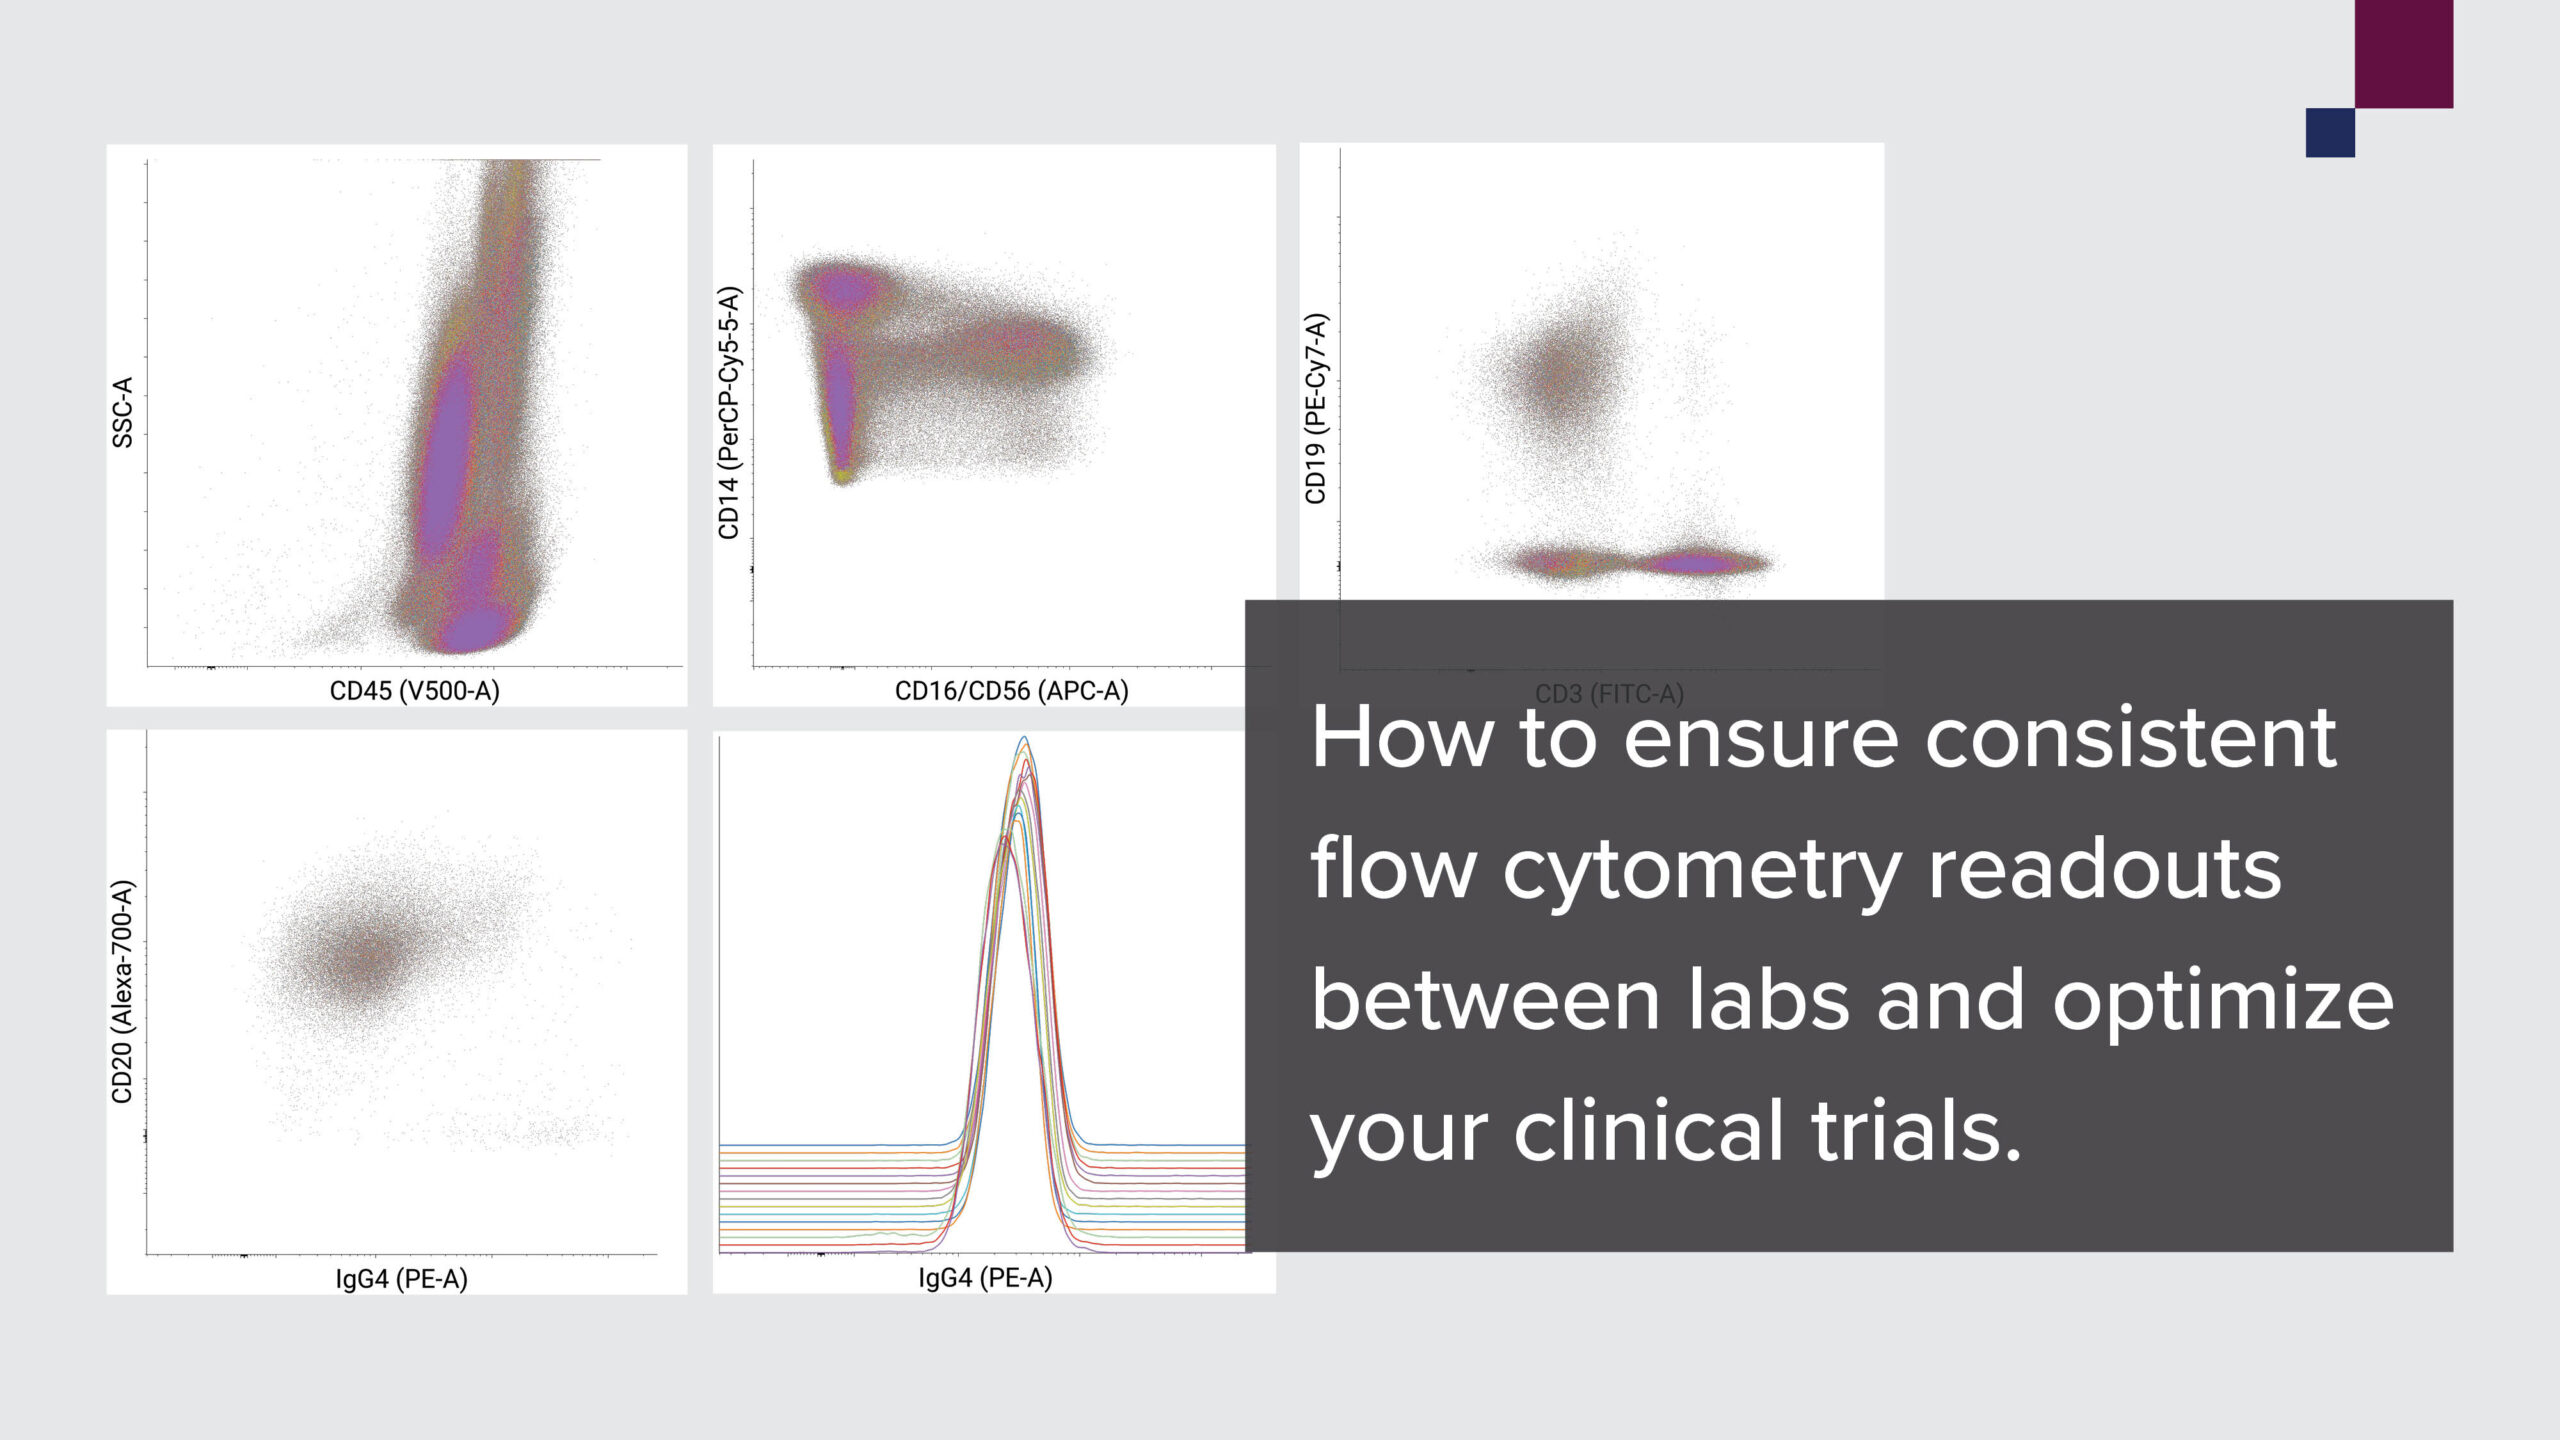
Clinical trials are often global in nature, with participants located across multiple sites. While data analysis for such trials is typically centralized, the data itself is produced at many different labs by various operators and instruments. As flow cytometry readouts (mean fluorescence intensity, or MFI) can vary between instruments and sites, it’s difficult and labor-intensive to ensure that they are standardized.

Inter- and intra-site variability of MFI readouts is a major issue for drug developers. Producing standardized measurements across sites is a crucial aspect of conducting successful clinical trials, and therefore key to progressing efficiently along the drug development pipeline.

Our preferred method to help address the issue of inconsistency is to ship reagents from the same lot between sites every time an assay is shared, to provide every lab with the same initial analytical tools. But this is an inefficient and unreliable solution that falls short of facilitating truly consistent analysis, with MFI readouts still potentially differing between stainings and operators.

However, new methods are being tested to bring greater consistency to multi-site flow cytometry, with promising results.

A new way to align flow cytometry instruments from lab to lab

CellCarta recently trialed a new approach to centralizing and standardizing flow cytometry assays across five global sites

A set of CD4 antibodies was stained on polystyrene microbeads (BD™ CompBeads) in fluorescent dyes (fluorochromes) covering the 18 colors of CellCarta’s flow cytometer (a BD LSRFortessa™). These beads were then lyophilized (freeze-dried), after which they were stable at room temperature for 18 months.

The stained and lyophilized beads were then shipped to five sites simultaneously for instrument alignment. Due to the long-term stability of the beads they only had to be shipped once, rather than a new reagent needing to be shipped per round of analysis.

After an initial setup and harmonization process, the beads were used to produce and adjust target values for 12 months (with a key criterion being stability of the MFI signal). Sites were able to create a baseline from which to detect and correct instrument fluctuations and eliminate any differences when these were used for sample analysis. In total, 10+ assays were standardized across five global locations.

The precision and performance of the lyophilized beads was tested over time to assure ongoing MFI stability, with any fluorochromes that were deemed to be underperforming swapped for more stable alternatives.

Fig 1: The assay was successfully shared across all our active sites. Nine fluorescence parameters were aligned using lyophilized BD™ CompBeads, before the assay’s precision was further tested by comparing 14 inter- and intra-site readouts of a reference sample and three healthy donors. To be deemed acceptable, the assays needed at least 80% of the predetermined readouts to have less than 25% CV when comparing reference and receiving laboratories.

The results? More reliable, consistent flow cytometry data across sites

The approach proved robust and reliable for multi-site instrument alignment, harmonizing numerous flow cytometric assays across sites (see Figure 1). Overall, the new approach demonstrated:

  • Long-term stability and precision, with comparable performance after one year and across fluorochromes (with all dyes remaining stable for 8 hours and most remaining stable for up to 48 hours post-resuspension)
  • Less variability in MFIs, by standardizing the analysis process and reducing any fluctuations arising from operator, instrument, or site differences. Using the transferred assays, 80%+ of readouts showed a coefficient of variation (CV) of less than 30% when comparing reference and receiving laboratories
  • Reliable assay transfer and alignment, with more than 10 flow cytometric assays successfully shared and implemented across 5 global site
  •  Time and cost savings, with reduced shipping and logistics requirements due to the 18-month stability of the lyophilized beads

While achieving reliable, standardized, high-quality flow cytometry data across lab locations can be challenging, this approach demonstrates a potential way to generate consistent data independent of location, instrument, and operator. Such a method could offer peace of mind to drug developers by supporting global clinical trials that require cost-efficient analysis and highly comparable data across geographical sites.

For more details on the alignment project, including its full aims, method, and results, see our research poster Multi-Site Instrument Alignment Using Lyophilized BD™ CompBeads.


About the author

author photo

Dominic Gagnon M.Sc. SCYM (ASCP)CM is the global flow cytometry Associate director at CellCarta. With a twenty years background in immune monitoring by flow cytometry as well as managing flow core, Dominic guides the team in the harmonization and standardization of cytometers and assays across all sites.

References

[1] Gagnon, D., and Lo, K. (2024) Multi-Site Instrument Alignment Using Lyophilized BDTM CompBeads. Available at: https://cellcarta.com/science-hub/multi-site-flow-compbeads.

Ensure Consistent Flow Cytometry & Optimize Clinical Trials

September 18, 2024

As more novel therapeutics have entered the drug development pipeline in recent years, flow cytometry has become a core analytical method for characterizing cells, molecules, and biomarkers for therapy evaluation. The technique is especially effective at assessing drugs targeting the immune system, and therefore particularly valuable in the areas of autoimmunity, oncology, and infectious diseases.

However, drug developers face a key challenge when using flow cytometry in clinical research: consistency. Why is this a hurdle, and how can we overcome it?

The challenges of using flow cytometry for clinical trial analysis

Clinical trials are often global in nature, with participants located across multiple sites. While data analysis for such trials is typically centralized, the data itself is produced at many different labs by various operators and instruments. As flow cytometry readouts (mean fluorescence intensity, or MFI) can vary between instruments and sites, it’s difficult and labor-intensive to ensure that they are standardized.

Inter- and intra-site variability of MFI readouts is a major issue for drug developers. Producing standardized measurements across sites is a crucial aspect of conducting successful clinical trials, and therefore key to progressing efficiently along the drug development pipeline.

Our preferred method to help address the issue of inconsistency is to ship reagents from the same lot between sites every time an assay is shared, to provide every lab with the same initial analytical tools. But this is an inefficient and unreliable solution that falls short of facilitating truly consistent analysis, with MFI readouts still potentially differing between stainings and operators.

However, new methods are being tested to bring greater consistency to multi-site flow cytometry, with promising results.

A new way to align flow cytometry instruments from lab to lab

CellCarta recently trialed a new approach to centralizing and standardizing flow cytometry assays across five global sites

A set of CD4 antibodies was stained on polystyrene microbeads (BD™ CompBeads) in fluorescent dyes (fluorochromes) covering the 18 colors of CellCarta’s flow cytometer (a BD LSRFortessa™). These beads were then lyophilized (freeze-dried), after which they were stable at room temperature for 18 months.

The stained and lyophilized beads were then shipped to five sites simultaneously for instrument alignment. Due to the long-term stability of the beads they only had to be shipped once, rather than a new reagent needing to be shipped per round of analysis.

After an initial setup and harmonization process, the beads were used to produce and adjust target values for 12 months (with a key criterion being stability of the MFI signal). Sites were able to create a baseline from which to detect and correct instrument fluctuations and eliminate any differences when these were used for sample analysis. In total, 10+ assays were standardized across five global locations.

The precision and performance of the lyophilized beads was tested over time to assure ongoing MFI stability, with any fluorochromes that were deemed to be underperforming swapped for more stable alternatives.

Fig 1: The assay was successfully shared across all our active sites. Nine fluorescence parameters were aligned using lyophilized BD™ CompBeads, before the assay’s precision was further tested by comparing 14 inter- and intra-site readouts of a reference sample and three healthy donors. To be deemed acceptable, the assays needed at least 80% of the predetermined readouts to have less than 25% CV when comparing reference and receiving laboratories.

The results? More reliable, consistent flow cytometry data across sites

The approach proved robust and reliable for multi-site instrument alignment, harmonizing numerous flow cytometric assays across sites (see Figure 1). Overall, the new approach demonstrated:

  • Long-term stability and precision, with comparable performance after one year and across fluorochromes (with all dyes remaining stable for 8 hours and most remaining stable for up to 48 hours post-resuspension)
  • Less variability in MFIs, by standardizing the analysis process and reducing any fluctuations arising from operator, instrument, or site differences. Using the transferred assays, 80%+ of readouts showed a coefficient of variation (CV) of less than 30% when comparing reference and receiving laboratories
  • Reliable assay transfer and alignment, with more than 10 flow cytometric assays successfully shared and implemented across 5 global site
  •  Time and cost savings, with reduced shipping and logistics requirements due to the 18-month stability of the lyophilized beads

While achieving reliable, standardized, high-quality flow cytometry data across lab locations can be challenging, this approach demonstrates a potential way to generate consistent data independent of location, instrument, and operator. Such a method could offer peace of mind to drug developers by supporting global clinical trials that require cost-efficient analysis and highly comparable data across geographical sites.

For more details on the alignment project, including its full aims, method, and results, see our research poster Multi-Site Instrument Alignment Using Lyophilized BD™ CompBeads.


About the author

author photo

Dominic Gagnon M.Sc. SCYM (ASCP)CM is the global flow cytometry Associate director at CellCarta. With a twenty years background in immune monitoring by flow cytometry as well as managing flow core, Dominic guides the team in the harmonization and standardization of cytometers and assays across all sites.

References

[1] Gagnon, D., and Lo, K. (2024) Multi-Site Instrument Alignment Using Lyophilized BDTM CompBeads. Available at: https://cellcarta.com/science-hub/multi-site-flow-compbeads.

Drug Target Engagement with Flow Cytometry Receptor Occupancy Assays

September 17, 2024

Receptor Occupancy Assays by Flow Cytometry

A crucial step in the drug development process involves optimizing drug-target engagement for your biotherapeutic and gaining valuable pharmacodynamic biomarker data. High-quality receptor occupancy assays (RO assays) are vital tools in this process.

Reliable and accurate results in the design, development, and implementation of receptor occupancy assays can seem to be a tasking prospect, as they are prone to numerous technical and logistical challenges, requiring-

  • expert assay design
  • optimal matrix selection
  • data normalization/reporting
  • and rigorous quality control1, 2

Such challenges can escalate further in difficult development scenarios, such as when the target antigen is expressed at low levels, where there is receptor modulation, or when the therapeutic molecules are bi-specific and bind multiple targets2.

Types and Methodologies

RO assays can be classified into two main types: competitive assays and saturation assays. Competitive assays involve the use of competitive and non-competitive antibodies to the drug, to note that the competitive antibody can also be substituted by an anti-drug antibody. Saturation assays use a competitive antibody and the drug product itself detected by an antibody as a reference point.

Type of Assay Description
Competing vs. non-competing antibodies Competing and non-competing antibodies are added to a sample. Competing antibodies bind to the drug's target site, indicating unbound targets. Non-competing antibodies bind elsewhere on the target, showing total available targets. Alternatively, the competing antibody can be substituted for a anti-drug antibody
Saturation assay Half of the sample is saturated with the drug, mimicking 100% RO, showing the total number of available target sites. The other half remains unsaturated, reflecting drug binding in the patient.
A secondary antibody detects the drug, this can be done using an anti-drug or an anti-Ig antibody, and the ratio of unsaturated to saturated samples reveals the drug's receptor occupancy (RO) level.

Custom RO Strategies for Enhanced Drug Development

CellCarta’s flow-cytometry-based receptor occupancy (RO) assays are designed to overcome these challenges and accelerate your efforts, providing you with the critical information needed to demonstrate target engagement, and gain insight into what degree and how long your biotherapeutic binds its target.

Our RO assays can also be used to complement your pharmacokinetic profiling to provide valuable information on dose selection and frequency of drug infusion. Additionally, RO assays can be validated to support secondary endpoints.

One of our RO strategies starts with the identification of both a competitive and a non-competitive antibody. The competitive antibody will only bind to its target if it is not currently bound by the drug, allowing identification of free receptors, while the non-competitive antibody identifies the total amount of target receptors.

We monitor receptor occupancy only in cell populations of interest by combining target-specific reagents into a flow cytometry panel of phenotypic markers. Competitive and non-competitive antibodies can even be used in the same panel.

When competitive or non-competitive antibodies cannot be identified, or when antibodies to the receptor are not available, we use a saturating vs. non-saturating approach to determine the receptor occupancy or RO.

The strategy involves saturation of half of the sample, mimicking a 100% RO. The other half is not saturated, allowing us to perform a ratio of drug-binding between the two halves to accurately determine the receptor occupancy of the sample.

Pharmacokinetic and Pharmacodynamic Insights

RO assays are integrated with pharmacokinetic (PK) and pharmacodynamic (PD) models to inform dosing strategies and optimize drug efficacy. These assays help determine the relationship between drug concentration and its biological effect, providing critical data for dose selection and frequency of administration. This integration is particularly valuable in clinical trials, where RO assays can serve as pharmacodynamic biomarker measurements to assess drug efficacy.

Choosing the ideal sample matrix for accurate RO Assays

The choice of sample matrix can have a profound effect on the quality of a RO assay. For example, PBMC processing can negatively impact the binding of the drug, resulting in an underestimation of the RO. We also typically test different vacutainers to maximize the stability and precision of the RO measurement.

Our experienced scientists develop and validate different RO strategies to address a variety of drug types and reagent availabilities, drawing on our extensive experience in deploying RO assay strategies in clinical trials.

Challenges and Considerations

Despite their importance, RO assays present several challenges. The development and optimization of these assays are complex and demand high-quality reagents and rigorous controls. Additionally, interpreting the data can be complicated by factors such as receptor internalization and degradation, necessitating a thorough understanding of the underlying biological processes.

Emerging Trends and Technological Breakthroughs in Receptor Occupancy Assays

Advanced technologies and methodologies are continually enhancing the accuracy and reliability of RO assays. Complex RO assays can provide additional insights into receptor internalization and shedding, contributing to a more comprehensive understanding of drug-target interactions. These advancements hold the potential to revolutionize drug development by providing more precise and detailed pharmacodynamic data.

CellCarta exemplifies these advancements with state-of-the-art flow cytometry and custom panels that ensure precise measurements, even in complex scenarios. This accuracy is crucial for informing dose selection and optimizing therapeutic efficacy. Emerging technologies like single-cell RNA sequencing and high-dimensional flow cytometry promise even deeper insights into drug-receptor interactions.

Step Up to the Next Level in Your RO Assay Development and Validation

Enhance the robustness of your RO assay development with our custom-designed panels and expert guidance, ensuring accurate and reliable data that drives informed decision-making in your drug development process.

Expert Insights: Watch the following video from our expert to mastering receptor occupancy assays with Flow Cytometry


About the author:

author photo

Damien Montamat-Sicotte is a Scientific Business Director at CellCarta, specializing in the flow cytometry platform. With a PhD in immunology and post-doctoral expertise from various institutions, Damien has profuse experience in managing the processing and analysis of clinical samples by flow cytometry in an immune monitoring context.

References

  1. Liang M, Schwickart M, Schneider AK, et al. Receptor occupancy assessment by flow cytometry as a pharmacodynamic biomarker in biopharmaceutical development. Cytometry B Clin Cytom 2016;90:117-27.
  2. Hilt E, Sun YS, McCloskey TW, et al. Best practices for optimization and validation of flow cytometry-based receptor occupancy assays. Cytometry B Clin Cytom 2021;100:63-71.

Drug Target Engagement with Flow Cytometry Receptor Occupancy Assays

September 17, 2024

Receptor Occupancy Assays by Flow Cytometry

A crucial step in the drug development process involves optimizing drug-target engagement for your biotherapeutic and gaining valuable pharmacodynamic biomarker data. High-quality receptor occupancy assays (RO assays) are vital tools in this process.

Reliable and accurate results in the design, development, and implementation of receptor occupancy assays can seem to be a tasking prospect, as they are prone to numerous technical and logistical challenges, requiring-

  • expert assay design
  • optimal matrix selection
  • data normalization/reporting
  • and rigorous quality control1, 2

Such challenges can escalate further in difficult development scenarios, such as when the target antigen is expressed at low levels, where there is receptor modulation, or when the therapeutic molecules are bi-specific and bind multiple targets2.

Types and Methodologies

RO assays can be classified into two main types: competitive assays and saturation assays. Competitive assays involve the use of competitive and non-competitive antibodies to the drug, to note that the competitive antibody can also be substituted by an anti-drug antibody. Saturation assays use a competitive antibody and the drug product itself detected by an antibody as a reference point.

Type of Assay Description
Competing vs. non-competing antibodies Competing and non-competing antibodies are added to a sample. Competing antibodies bind to the drug's target site, indicating unbound targets. Non-competing antibodies bind elsewhere on the target, showing total available targets. Alternatively, the competing antibody can be substituted for a anti-drug antibody
Saturation assay Half of the sample is saturated with the drug, mimicking 100% RO, showing the total number of available target sites. The other half remains unsaturated, reflecting drug binding in the patient.
A secondary antibody detects the drug, this can be done using an anti-drug or an anti-Ig antibody, and the ratio of unsaturated to saturated samples reveals the drug's receptor occupancy (RO) level.

Custom RO Strategies for Enhanced Drug Development

CellCarta’s flow-cytometry-based receptor occupancy (RO) assays are designed to overcome these challenges and accelerate your efforts, providing you with the critical information needed to demonstrate target engagement, and gain insight into what degree and how long your biotherapeutic binds its target.

Our RO assays can also be used to complement your pharmacokinetic profiling to provide valuable information on dose selection and frequency of drug infusion. Additionally, RO assays can be validated to support secondary endpoints.

One of our RO strategies starts with the identification of both a competitive and a non-competitive antibody. The competitive antibody will only bind to its target if it is not currently bound by the drug, allowing identification of free receptors, while the non-competitive antibody identifies the total amount of target receptors.

We monitor receptor occupancy only in cell populations of interest by combining target-specific reagents into a flow cytometry panel of phenotypic markers. Competitive and non-competitive antibodies can even be used in the same panel.

When competitive or non-competitive antibodies cannot be identified, or when antibodies to the receptor are not available, we use a saturating vs. non-saturating approach to determine the receptor occupancy or RO.

The strategy involves saturation of half of the sample, mimicking a 100% RO. The other half is not saturated, allowing us to perform a ratio of drug-binding between the two halves to accurately determine the receptor occupancy of the sample.

Pharmacokinetic and Pharmacodynamic Insights

RO assays are integrated with pharmacokinetic (PK) and pharmacodynamic (PD) models to inform dosing strategies and optimize drug efficacy. These assays help determine the relationship between drug concentration and its biological effect, providing critical data for dose selection and frequency of administration. This integration is particularly valuable in clinical trials, where RO assays can serve as pharmacodynamic biomarker measurements to assess drug efficacy.

Choosing the ideal sample matrix for accurate RO Assays

The choice of sample matrix can have a profound effect on the quality of a RO assay. For example, PBMC processing can negatively impact the binding of the drug, resulting in an underestimation of the RO. We also typically test different vacutainers to maximize the stability and precision of the RO measurement.

Our experienced scientists develop and validate different RO strategies to address a variety of drug types and reagent availabilities, drawing on our extensive experience in deploying RO assay strategies in clinical trials.

Challenges and Considerations

Despite their importance, RO assays present several challenges. The development and optimization of these assays are complex and demand high-quality reagents and rigorous controls. Additionally, interpreting the data can be complicated by factors such as receptor internalization and degradation, necessitating a thorough understanding of the underlying biological processes.

Emerging Trends and Technological Breakthroughs in Receptor Occupancy Assays

Advanced technologies and methodologies are continually enhancing the accuracy and reliability of RO assays. Complex RO assays can provide additional insights into receptor internalization and shedding, contributing to a more comprehensive understanding of drug-target interactions. These advancements hold the potential to revolutionize drug development by providing more precise and detailed pharmacodynamic data.

CellCarta exemplifies these advancements with state-of-the-art flow cytometry and custom panels that ensure precise measurements, even in complex scenarios. This accuracy is crucial for informing dose selection and optimizing therapeutic efficacy. Emerging technologies like single-cell RNA sequencing and high-dimensional flow cytometry promise even deeper insights into drug-receptor interactions.

Step Up to the Next Level in Your RO Assay Development and Validation

Enhance the robustness of your RO assay development with our custom-designed panels and expert guidance, ensuring accurate and reliable data that drives informed decision-making in your drug development process.

Expert Insights: Watch the following video from our expert to mastering receptor occupancy assays with Flow Cytometry


About the author:

author photo

Damien Montamat-Sicotte is a Scientific Business Director at CellCarta, specializing in the flow cytometry platform. With a PhD in immunology and post-doctoral expertise from various institutions, Damien has profuse experience in managing the processing and analysis of clinical samples by flow cytometry in an immune monitoring context.
References

  1. Liang M, Schwickart M, Schneider AK, et al. Receptor occupancy assessment by flow cytometry as a pharmacodynamic biomarker in biopharmaceutical development. Cytometry B Clin Cytom 2016;90:117-27.
  2. Hilt E, Sun YS, McCloskey TW, et al. Best practices for optimization and validation of flow cytometry-based receptor occupancy assays. Cytometry B Clin Cytom 2021;100:63-71.

Optimal FFPE Tissue Fixation, Processing, and Embedding: A Comprehensive Guide

September 4, 2024

Optimal fixation, processing, and embedding of Formalin-Fixed, Paraffin-Embedded (FFPE) tissue are crucial steps in histological examination. These initial stages ensure high-quality staining, imaging, and quantitative analysis of tissue morphology and biomarker localization. This guide provides an overview of common fixation, processing, and embedding methods for FFPE rodent tissue.

Fixation for FFPE Tissue

Proper tissue fixation preserves the tissue architecture, including cells, cellular components (cytoplasm, nuclei, organelles), extracellular material, and molecular components (proteins, DNA, mRNA). Various tissue fixatives are available, each with specific advantages and disadvantages depending on the application. Timing is also key. The cold ischemia time, time from removal of tissue until placement in fixative, should not exceed 1 hour.

Common Fixative: 10% Neutral Buffered Formalin (10% NBF)

10% NBF is the most widely used fixative in routine diagnostic pathology due to its ability to preserve tissue effectively. Key factors for optimal results include:

  • Specimen Thickness: Trim tissue to 2-3 mm before placing it in fixative.
  • Volume Ratio: Use a minimum of one part tissue to 20 parts fixative. Ensure the fixative is free of blood.
  • Fixation Time: Depending on sample size, tissues are fixed for 6 to 72 hours at room temperature before processing into paraffin wax.
  • Storage: Store tissues in 70% ethanol post-fixation, though this is not recommended for brain or neurological samples.

For tissues like eyes, lungs, intestines, and bones that may require different fixatives or special processing, contact our expert team for guidance on the appropriate tissue fixation techniques.

Processing for and Embedding of FFPE Tissue

Fixed tissues are typically processed using automated tissue processors and embedded in paraffin wax. This process involves immersing samples in a series of solutions, including alcohols, xylene, and paraffin wax. Customization of each step—time, temperature, and pressure/vacuum (P/V)—ensures optimal solution penetration.

Our histologists have developed specific tissue processing schedules tailored to different tissue types, ensuring high-quality outcomes. Understanding the steps of tissue processing is essential for maintaining the integrity of FFPE samples.

High-quality embedding requires consistent orientation of all samples of the same tissue type. While samples can be embedded in various orientations upon request, we typically follow the Registry of Industrial Toxicology Animal (RITA) and North American Control Animal Database (NACAD) Guidelines for rodent tissue embedding.

If your study requires a different tissue embedding orientation, please specify in advance, and we will accommodate your needs.

Keeping FFPE on top of mind

Optimal fixation, processing, and embedding are critical steps for examining tissue morphology and biomarker localization in FFPE tissue samples. Our expert team can assist you with all aspects of formalin-fixed paraffin-embedded tissue preparation. Contact us if you have any questions, our team is here to ensure your histology workflow is optimized for the best results.

Optimal FFPE Tissue Fixation, Processing, and Embedding: A Comprehensive Guide

September 4, 2024

Optimal fixation, processing, and embedding of Formalin-Fixed, Paraffin-Embedded (FFPE) tissue are crucial steps in histological examination. These initial stages ensure high-quality staining, imaging, and quantitative analysis of tissue morphology and biomarker localization. This guide provides an overview of common fixation, processing, and embedding methods for FFPE rodent tissue.

Fixation for FFPE Tissue

Proper tissue fixation preserves the tissue architecture, including cells, cellular components (cytoplasm, nuclei, organelles), extracellular material, and molecular components (proteins, DNA, mRNA). Various tissue fixatives are available, each with specific advantages and disadvantages depending on the application. Timing is also key. The cold ischemia time, time from removal of tissue until placement in fixative, should not exceed 1 hour.

Common Fixative: 10% Neutral Buffered Formalin (10% NBF)

10% NBF is the most widely used fixative in routine diagnostic pathology due to its ability to preserve tissue effectively. Key factors for optimal results include:

  • Specimen Thickness: Trim tissue to 2-3 mm before placing it in fixative.
  • Volume Ratio: Use a minimum of one part tissue to 20 parts fixative. Ensure the fixative is free of blood.
  • Fixation Time: Depending on sample size, tissues are fixed for 6 to 72 hours at room temperature before processing into paraffin wax.
  • Storage: Store tissues in 70% ethanol post-fixation, though this is not recommended for brain or neurological samples.

For tissues like eyes, lungs, intestines, and bones that may require different fixatives or special processing, contact our expert team for guidance on the appropriate tissue fixation techniques.

Processing for and Embedding of FFPE Tissue

Fixed tissues are typically processed using automated tissue processors and embedded in paraffin wax. This process involves immersing samples in a series of solutions, including alcohols, xylene, and paraffin wax. Customization of each step—time, temperature, and pressure/vacuum (P/V)—ensures optimal solution penetration.

Our histologists have developed specific tissue processing schedules tailored to different tissue types, ensuring high-quality outcomes. Understanding the steps of tissue processing is essential for maintaining the integrity of FFPE samples.

High-quality embedding requires consistent orientation of all samples of the same tissue type. While samples can be embedded in various orientations upon request, we typically follow the Registry of Industrial Toxicology Animal (RITA) and North American Control Animal Database (NACAD) Guidelines for rodent tissue embedding.

If your study requires a different tissue embedding orientation, please specify in advance, and we will accommodate your needs.

Keeping FFPE on top of mind

Optimal fixation, processing, and embedding are critical steps for examining tissue morphology and biomarker localization in FFPE tissue samples. Our expert team can assist you with all aspects of formalin-fixed paraffin-embedded tissue preparation. Contact us if you have any questions, our team is here to ensure your histology workflow is optimized for the best results.