CDx
Contact Us

AI and Data Analytics

Our bioinformatics team delivers reliable, interpretable results from clinical datasets of any size, complexity, and therapeutic focus.

Connect With Our Experts
AI And Data Analytics HERO 869

Complete Data Extraction

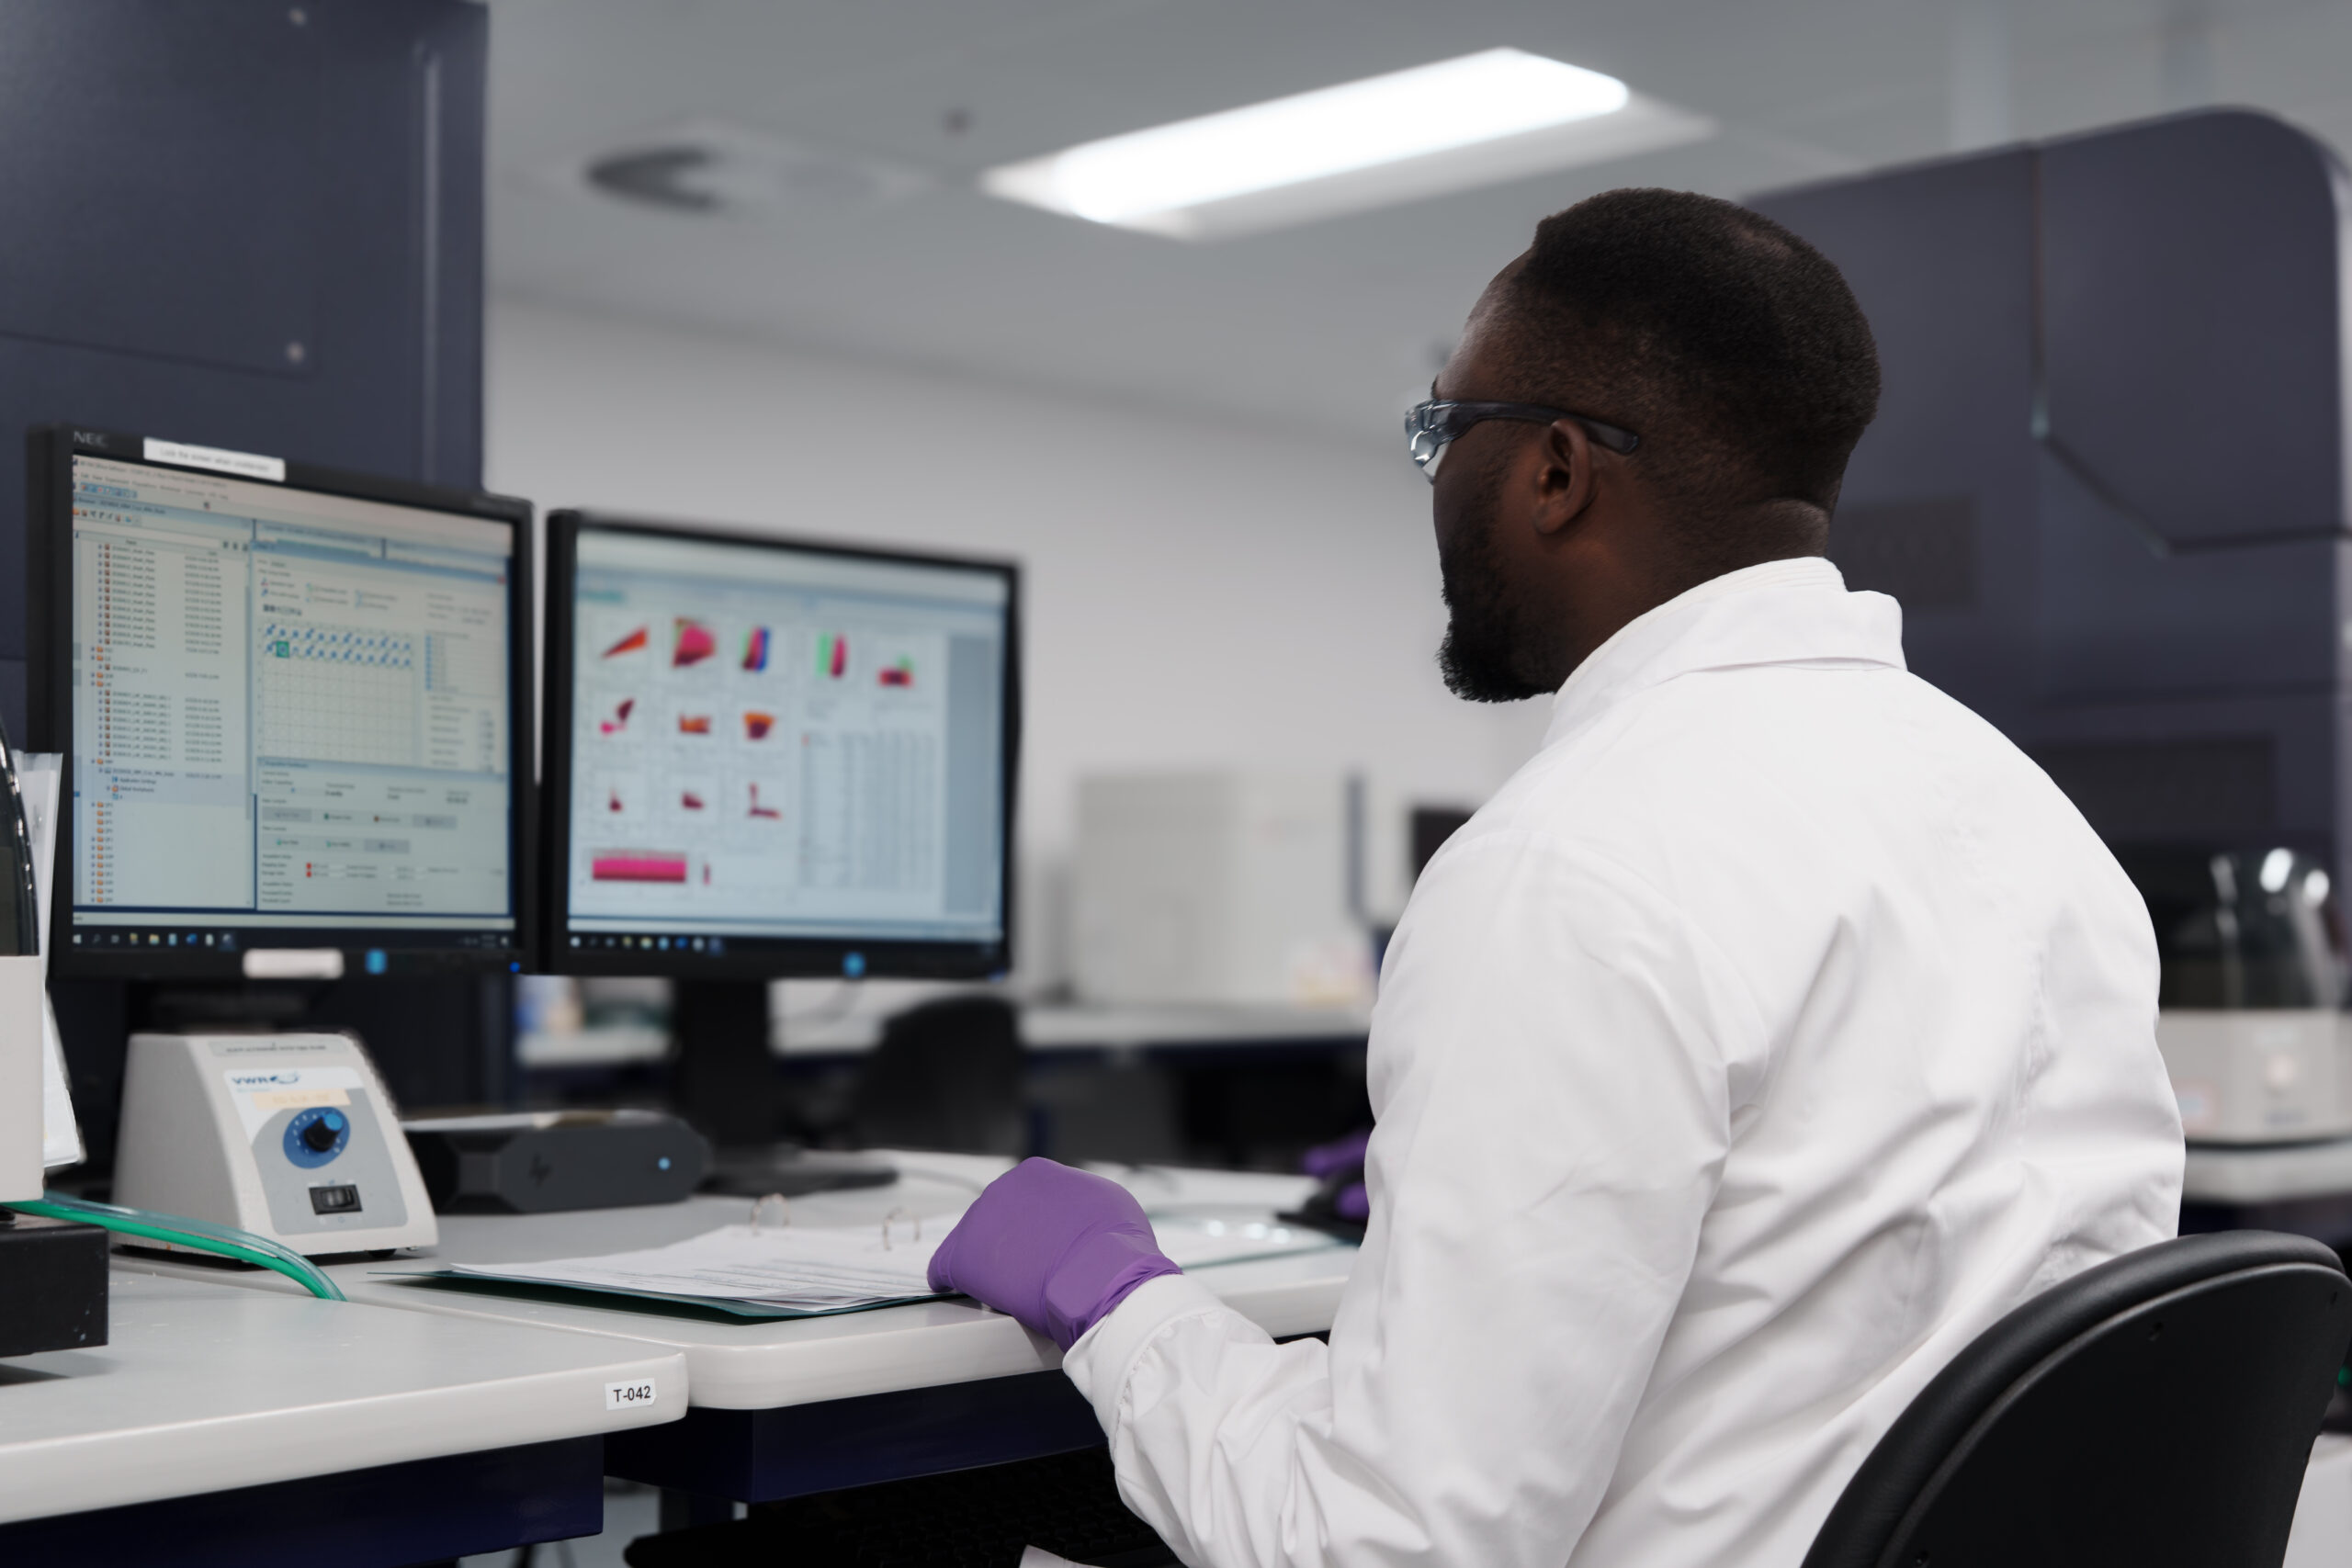
Our data analytical services can process large, complex datasets to extract valuable insights that are consistent, reliable, and interpretable. Our AI-assisted platforms and expertise across proteomics, genomics, histopathology, and immune monitoring means CellCarta’s analytical services can be seamlessly integrated into your research at any stage of development.

All our bioanalytical services are backed by an experienced in-house team of bioinformaticians and biostatisticians who work in close collaboration with clients to select the right method of analysis for each study objective.

25+ Years of biomarker expertise
90+ Validated analysis pipelines
750+ Expert scientist
Complete Data Extraction 851

The Challenge

Generating meaningful and reliable results from large datasets is often challenging for clinical teams. This necessitates capabilities ranging from custom data visualization to statistical analysis.

How CellCarta Solves This

CellCarta's comprehensive data analysis services include raw data processing and quality control all the way through biological interpretation and customized reporting.

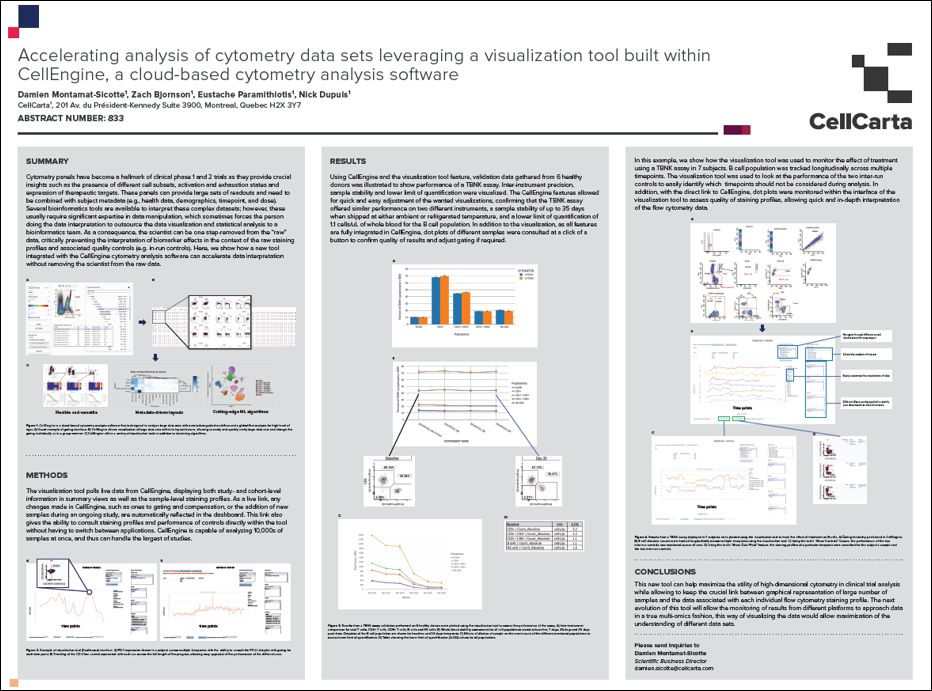
CellEngine® handles cytometry data at the scale clinical programs demand. Our cloud-based software enables rapid, high-quality data processing, powerful visualization, and can be leveraged as a software-as-a-service (SaaS) for independent analysis.

For genomic programs, validated bio-IT pipelines cover alignment, variant calling, QC reporting, differential gene expression, pathway enrichment, and downstream biomarker analysis.

Finally, the bioinformatics and biostatistics layer applies exploratory data analysis, normalization, clustering, machine learning, and pathway analysis across proteomic, genomic, and immune monitoring platforms.


Case Studies

Predict With RNAseq Infobox

Case Study

Predict with RNAseq

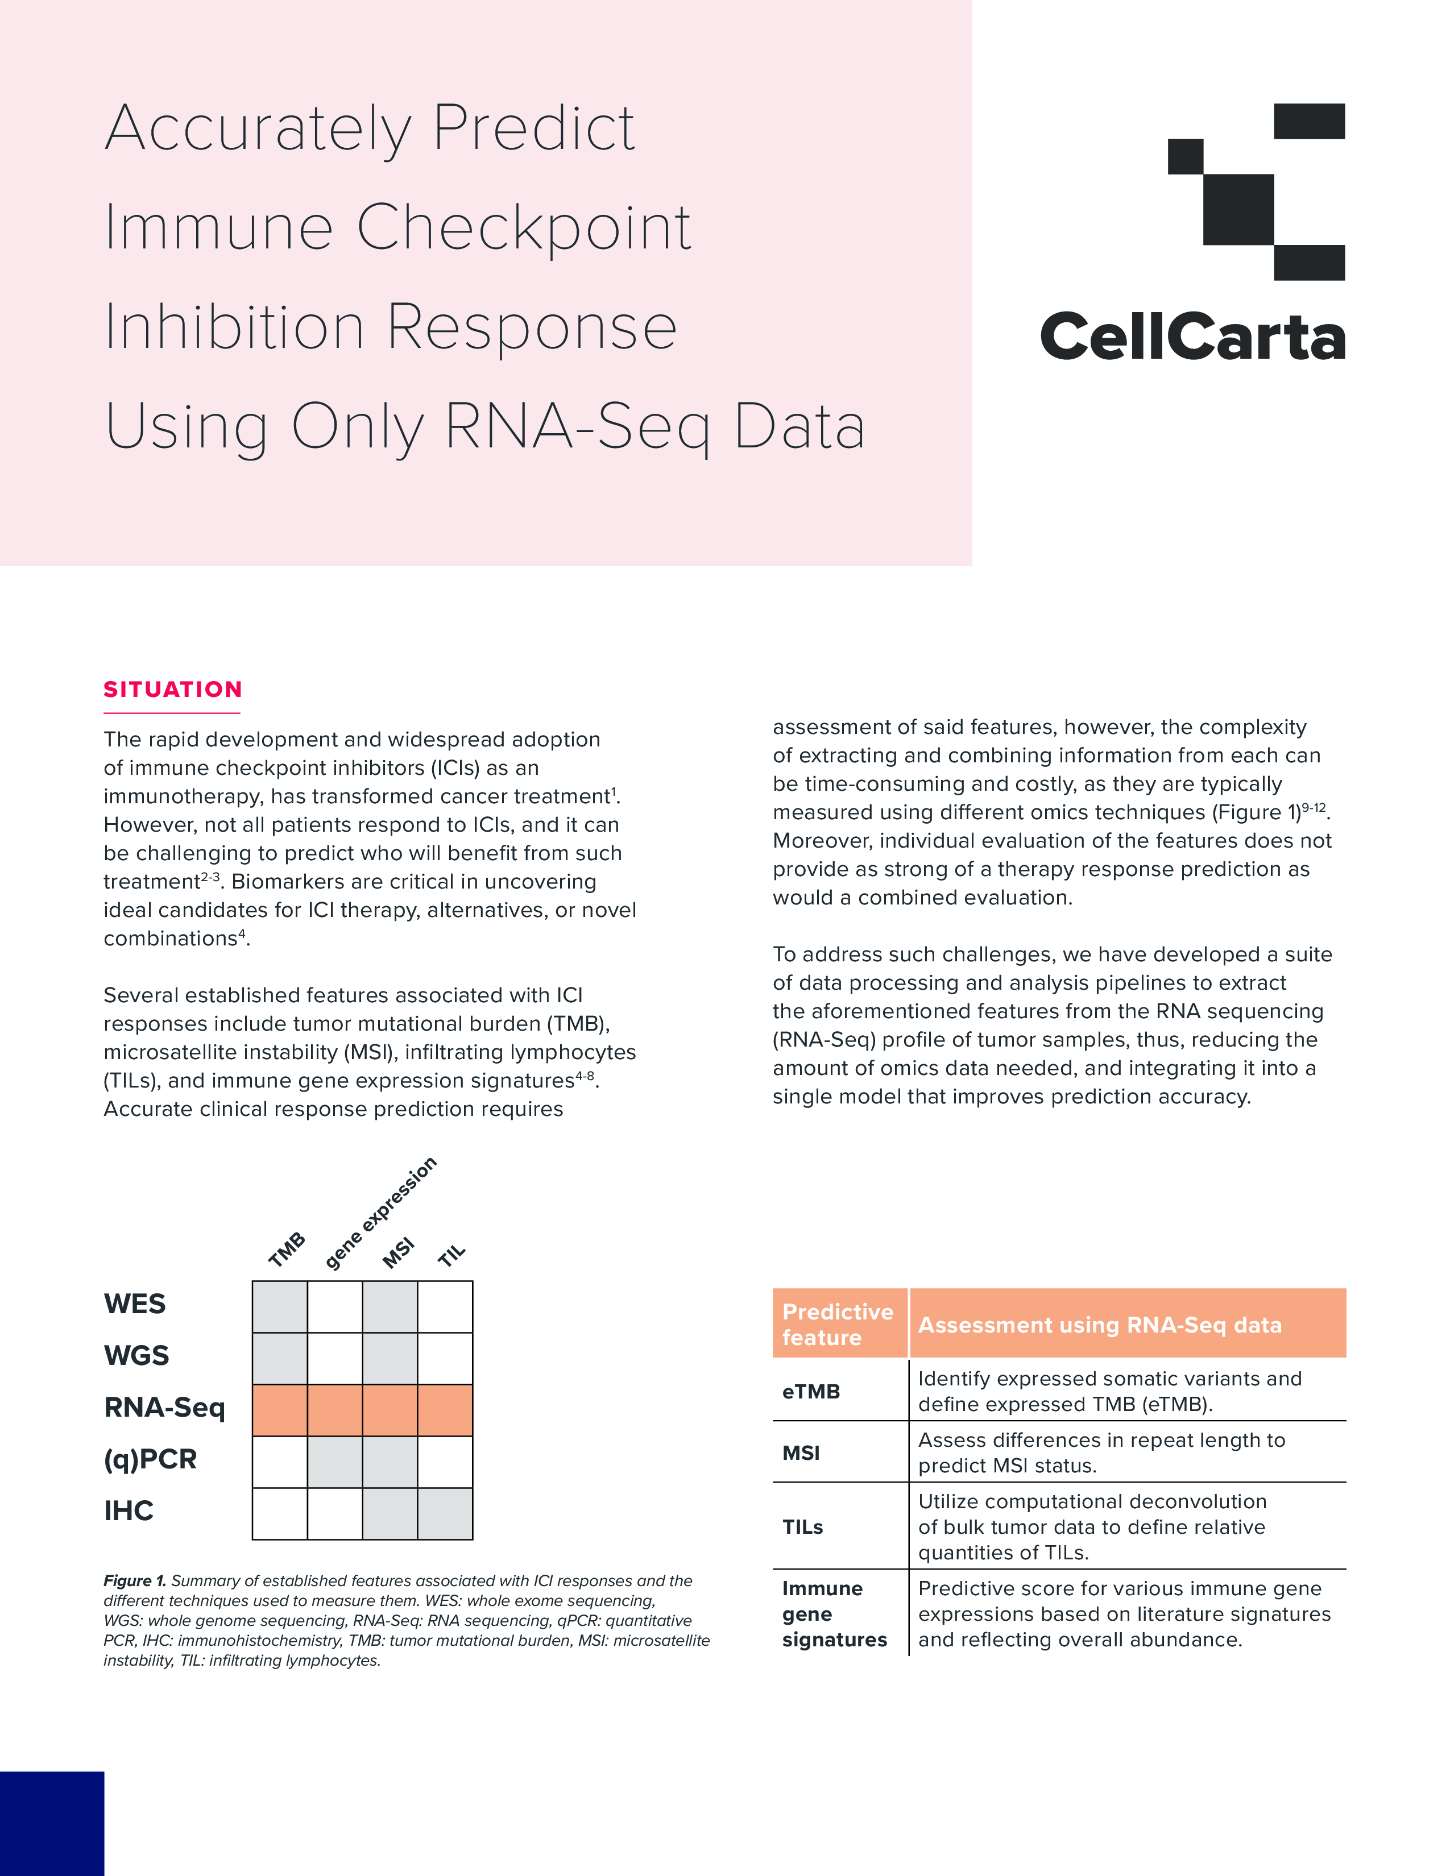
CellCarta developed the RNA-Seq Bio-IT model that extracts information on eTMB, MSI, tumor infiltrating lymphocytes (TILs), and immune gene signatures using only RNAseq data. This model accurately predicts patient response to immune checkpoint inhibition therapy without using a multiomics approach.

AI Powered Spatial Analysis Infobox

Case Study

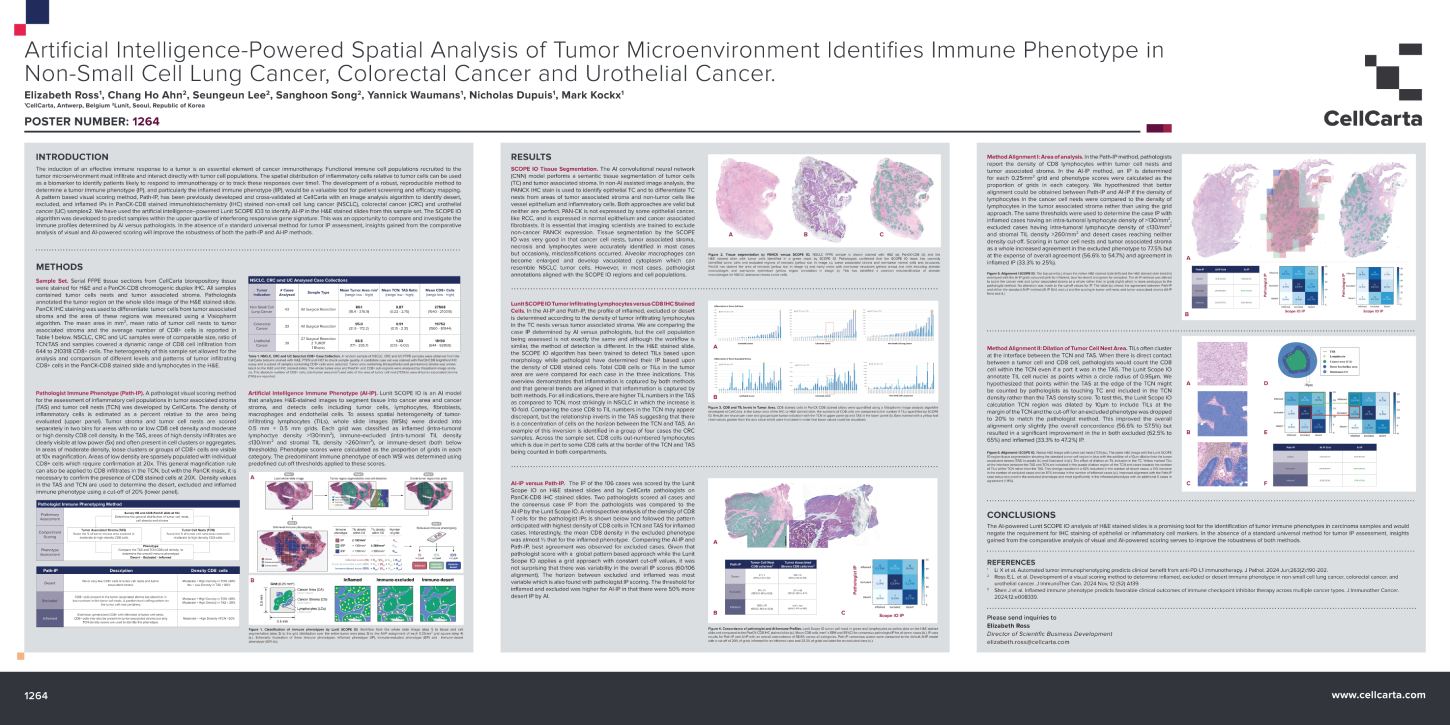
AI-Powered Spatial Analysis

CellCarta performed a comparative analysis of the immune profiles of carcinoma samples when evaluated by the AI-powered Lunit SCOPE IO platform or manually by pathologists. Insights gained from this analysis serve to improve the robustness of both methods for immune phenotype investigations.

Full support from data analysis experts

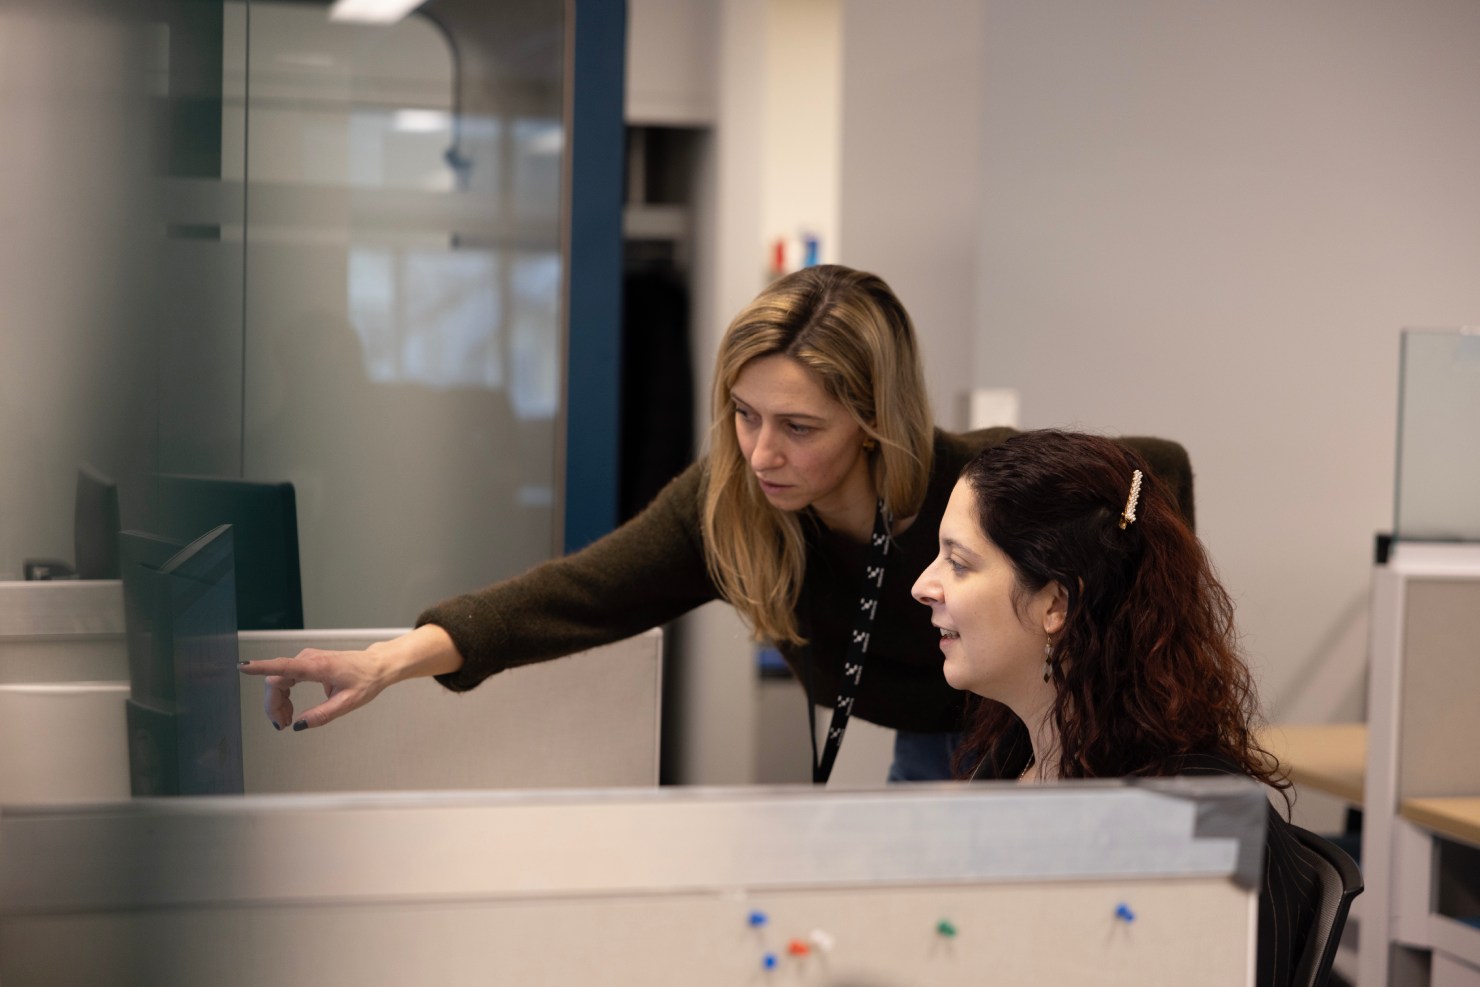
CellCarta's analytical team works in close collaboration with clients to select the right method of analysis and ensure the full value of every dataset is realized.

105 Cta Banner

Frequently Asked Questions

Our genomic data analysis service has developed bio-IT pipelines for gene expression (e.g., RNA sequencing and NanoString nCounter), quantitative PCR and digital PCR datasets, whole genome and whole exome sequencing, single-cell sequencing analysis, and spatial biology datasets. Standard processing and custom analysis are both available, and data transfer can be tailored to project-specific needs using AWS S3, SFTP, or proprietary platforms.


CellEngine® is CellCarta's proprietary cytometry analysis software, used to power global flow cytometry analysis services. It is available as part of our bioanalytical workflow or as SaaS platform, allowing clients to analyze their FCS files independently. CellEngine® is compatible with FCS files from more than 45 cytometers and is validated for use in 21 CFR 11-compliant environments. Furthermore, API toolkits in R and Python support integration with LIMS, ELN, and EMR systems.

CellCarta provides both standard and customized reports, determined by study design and the statistical analysis plan. Customized reports can include ratios, basic normalization, and biological interpretation to accelerate understanding of complex datasets. The bioinformatics and biostatistics team employs exploratory data analysis to identify outliers and patterns, normalization to remove sample processing bias, expression analysis to assess relationships between clinical variables and expression levels, visualization tools such as heatmaps for context and interpretation, machine learning for biomarker classification and predictive panel design, clustering to improve patient grouping, and pathway analysis to understand mechanisms of action.

See our bioinformatics services to learn more.