September 12, 2022

Today’s high-dimensional cytometry can measure dozens of analytes for millions of cells, and high-throughput cytometers can generate thousands of files, totaling hundreds of gigabytes of data. With most software, analyzing this amount of data is slow, creating complex visualizations can be difficult or impossible, and sharing data with coworkers and collaborators can be cumbersome. Finally, few programs provide regulatory compliance features necessary for running clinical trials.
CellEngineTM addresses the gaps where other software fails
CellEngine is a cloud-based cytometry analysis software platform, designed to tackle these challenges. CellEngine provides fast, full analytical and visualization functionality in one software program. Its cloud-native design allows easy collaboration, while providing enterprise-grade data safety and security. A first-class API offers full access to any CellEngine feature, allowing easy integration into bioinformatics pipelines and LIMS systems. For research performed in regulated environments, CellEngine supplies all the features needed for use in 21 CFR 11-compliant workflows.
Lightning-fast analysis of large, complex datasets
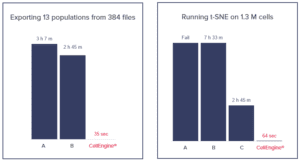
CellEngine is orders of magnitude faster than other analysis software. Optimized by performance experts to achieve the speed needed to analyze large, high-dimensional datasets, CellEngine provides rapid analysis that is easy for anyone to use—no coding skills required. CellEngine can run advanced analysis pipelines with PhenoGraph, t-SNE, UMAP, SOM, and more on millions of cells in just minutes. In a head-to-head comparison of CellEngine and other software, 384 data files were analyzed from 13 different populations. The other software took hours, while CellEngine took seconds. With a more complex t-SNE visualization, CellEngine only took minutes instead of hours.

Versatile analysis and advanced visualization of high-dimensional cytometry data
A wide variety of options for visualizations can be created within CellEngine, all driven by your experiment metadata. Dot plots, histograms, heatmaps, dose response curves, metadata-driven layouts, and algorithmic visualizations are available to distill your data into figures and slides.
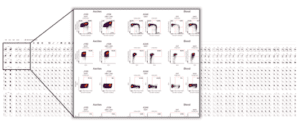
CellEngine can easily create pivot tables and batched analysis across samples or experimental conditions, allowing quick visualization of large datasets. Metadata-driven layouts take seconds to create by simply annotating files and selecting visualization parameters. In the pivot table below, various samples are organized by time points, conditions, and patient, providing a highly informative output for longitudinal studies.

Supervised autogating for trusted data in less time
CellEngine includes a built-in tool for supervised autogating by using the power of machine-learning to automatically tailor your gates. The tool uses a small set of manually gated files from your dataset and adjusts gate positions to match in seconds. This approach reduces subjectivity and increases consistency, while saving massive amounts of time.
How does CellCarta utilize CellEngine to meet our clients’ needs?
As a flow and mass cytometry CRO, CellCarta generates many high-dimensional data files daily and outgrew our previous software. CellEngine’s speed and visualization features are invaluable for analyzing multi-year clinical studies with thousands of samples. Because CellEngine is cloud-based, it allows for secure, easy communication of data and analysis to our clients. Its 21 CFR 11 compliance allows us to use it in primary and secondary endpoint studies. CellEngine’s rich API integrates into our bioinformatics pipelines, performing tasks such as automatic data upload and pre-processing. CellCarta provides more informative data to our clients, faster, helping them to rapidly advance their therapeutics.
Welcome to a new generation of cytometry analysis software. Let CellEngine make your data talk. Sign up for a free two-month trial or contact us for a live demo.
Watch the following video from our expert to learn more.
About the author:

Susan Reynolds is a Scientific Business Director at CellCarta specializing in multi-omic flow cytometric application platforms. She has held various roles in the industry with emphasis on strategic development and commercialization of emerging novel platforms.
You might also be interested by
CellTalk Blog
How to Select the Optimal TBNK Panel: Matching Immune Monitoring to Clinical Context
November 25, 2025
Immune Monitoring
More infoCellTalk Blog
ELISpot vs. ICS: Optimizing Immune Monitoring in Clinical Trials with the Right Functional Assay
November 19, 2024
Immune Monitoring
More infoCellTalk Blog
Measure Target Engagement With Receptor Occupancy Assays by Flow Cytometry
September 17, 2024
Immune Monitoring
More infoBrochures & Infographics
High Performance Technologies for Cytokine Measurement
July 29, 2024
Immune Monitoring
More info